How to understand the Team Effectiveness model - theliberators/columinity.docs GitHub Wiki
The model behind the Columinity offers guidance on what to improve. We developed this model through our research with over 1.900+ Scrum teams. We identified 5 core factors and many lower-order factors determining how effective Scrum Teams are at delivering valuable outcomes.
Effective teams
We consider a team effective when it has satisfied stakeholders (customers, users, internal stakeholders, etc) and when team morale is high. This definition doesn't cover everything (like ROI), but it works across many different teams. It is also common in team research.
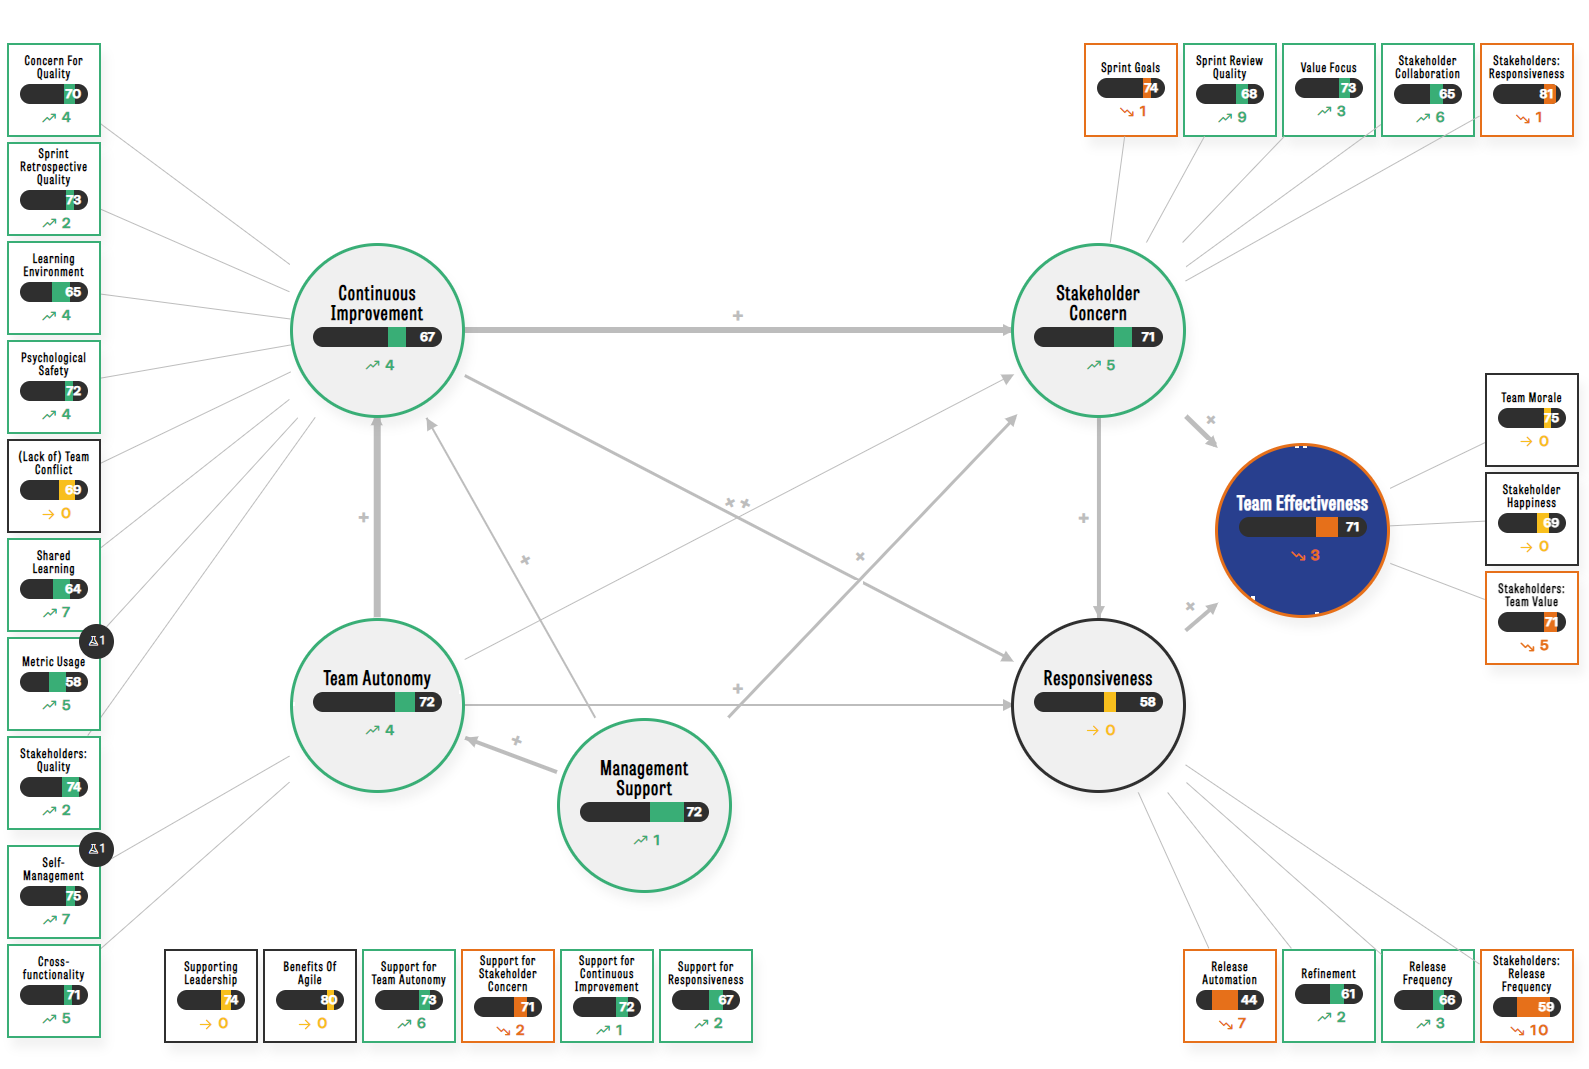
In the model visualization, team effectiveness is represented with the blue sphere. Its score is calculated from the measures of team morale, stakeholder happiness, and team value. The first two are measured from the perspective of team members, and the last is measured from the perspective of stakeholders. This means that we include the evaluation of both team members and stakeholders.
Five core factors
What makes some teams more effective than others? With data from over 2.000 teams, we identified five core factors that explain a large chunk of team effectiveness. These are: stakeholder concern, responsiveness, continuous improvement, team autonomy, and management support. Each core factor represents several lower-order factors.
The gray spheres in the model visualization represent the core factors. The score for each is calculated from the lower-order factors, which are represented as the white squares. For example, Team Autonomy is based on Self-Management and Cross-Functionality.
Effects
We also investigated how the core factors work together to determine how effective teams can be. For example, Stakeholder Concern and Responsiveness contribute directly to team effectiveness. But the effect of Team Autonomy is indirect. It encourages Continuous Improvement in teams, which in turn increases Stakeholder Concern and Responsiveness. Management Support boosts all core factors, but particularly Team Autonomy. These effects can guide our improvements.
In the model visualization, the arrows between the core factors indicate their direction and strength. We derived these values from our research, and they represent the average strength in most teams.
Models are always incomplete simplifications
Our model covers the areas that we found to be most relevant to the effectiveness of most teams. This is a great starting point to diagnose and improve teams. However, every model is inherently a simplification of a complex reality. Models are also a generalization. So don't limit your diagnosis to just our model. your team may be influenced strongly by factors that we didn't include in our model. So interpret the results and identify improvements together. And let us know at [email protected] what you think is missing.
How do we measure this model?
We calculate the score for each factor through psychometric scales. Each factor is measured by one or more questions that are designed to measure the same factor, but from a slightly different angle. This reduces bias due to different interpretations and provides more statistical variance to work with. We carefully developed the scales and their questions through our research.
Learn more about how we calculate the results here.