PromQL Selecting timeseries data - the-code-camp/hpe-sre GitHub Wiki
Our very first step is to learn how to select data in PromQL. Let's see how to select and filter data based on its metric name and labels at a single timestamp or over a range over time, and how to select data in a time-shifted way.
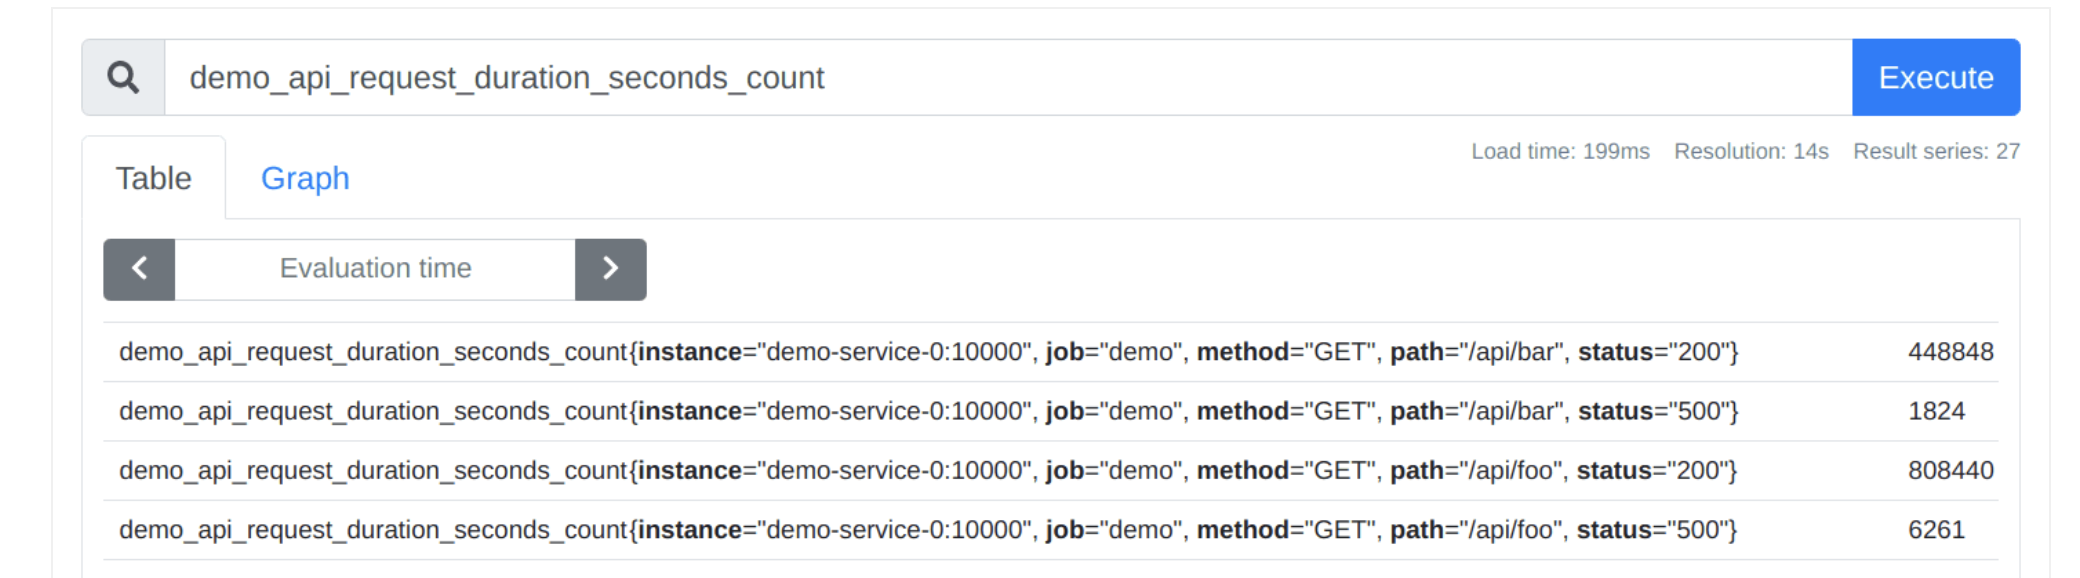
This query will return all series that have the metric name demo_api_request_duration_seconds_count:
demo_api_request_duration_seconds_count
You can paste that into the Prometheus expression browser to run the query.
This will return many series that all share the same metric name, but have different label value combinations for the instance, job, method, path and status labels. The output of running that query will look like this:
To query only those series of the demo_api_request_duration_seconds_count metric that have the method="POST" label, append that condition in curly braces right after the metric name:
demo_api_request_duration_seconds_count{method="POST"}
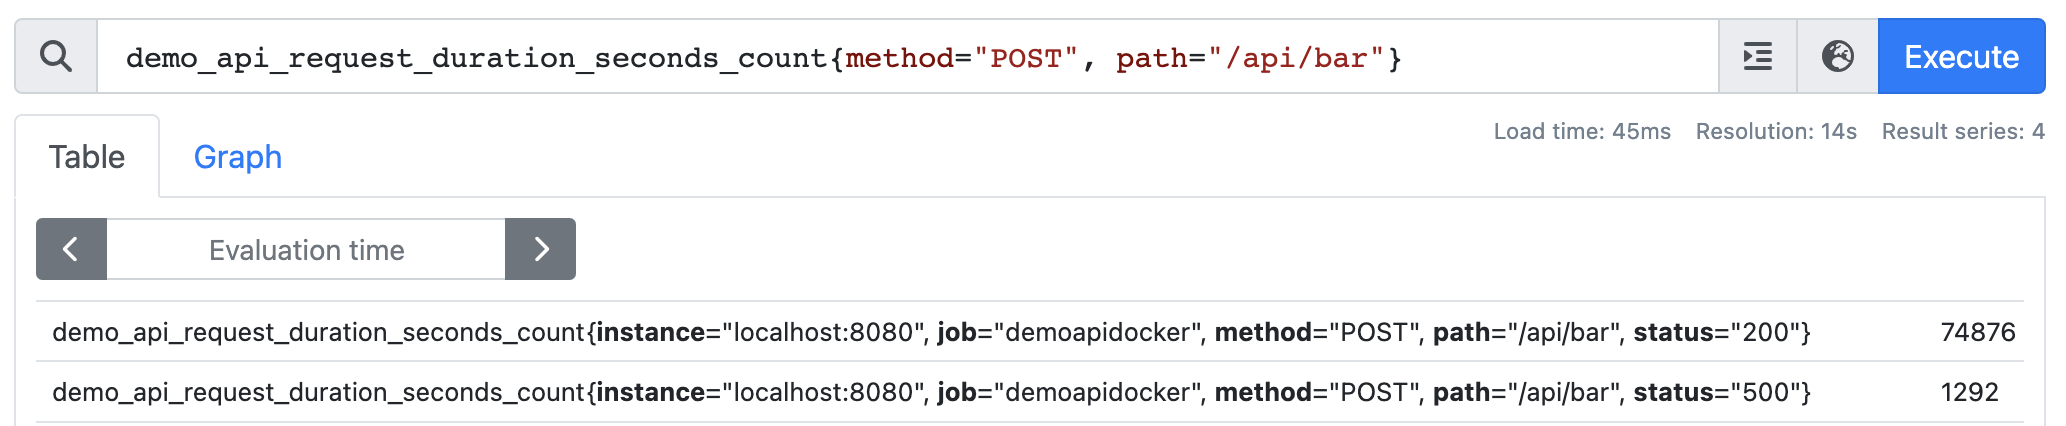
You can then also add more label matchers using commas - note that when combining multiple matchers, all of them need to apply in order to select a series.
demo_api_request_duration_seconds_count{method="POST", path="/api/bar"}
The result may look like this:
 '
'
You can even omit the metric name completely and retrieve all series whose path label starts with /api:
{path=~"/api.*"}
Go ahead and run that and you will see different metric names returned in the result set! Including counters, sums, etc..
Internally, the metric name is also just a special label with the name name. So this query:
demo_api_request_duration_seconds_count
...is just a short-hand form for this equivalent query:
{__name__="demo_api_request_duration_seconds_count"}
Writing selectors as above gives us the single latest value for all selected series. This is what's known as an instant vector. However, some functions require you to pass not a single value, but a range of values for each series over time.
You can change an instant vector selector into a range vector selector by appending a duration specifier in the form of [] (e.g. [5m] for 5 minutes).
To query for the free memory in bytes over the last 5 minutes - note the square brackets - go ahead and run this query:
demo_memory_usage_bytes{type="free"}[5m]
Valid duration units are:
ms - milliseconds s - seconds m - minutes h - hours d - days y - years
Sometimes you need to access past data in a time-shifted way, usually to compare it to current data. To time-shift past data into the present, append an offset modifier to any range or instant series selector (e.g. my_metric offset 5m or my_metric[1m] offset 7d).
For example, to select the free memory one hour ago, run this query:
demo_memory_usage_bytes{type="free"} offset 1h
-
Build a query that selects all series.
Hint: All series in Prometheus always have at least a metric name (name label), and in the demo Prometheus server, all series also have a job label.
-
Build a query that selects all series with the metric name
demo_api_request_duration_seconds_countwhere the method label is not POST. -
Build a query that selects a time range of 1 minute of free memory (using the metric
demo_memory_usage_bytes) fromthirty minutes ago.