Software Details - tangentaudio/opencv_tank_gauge GitHub Wiki
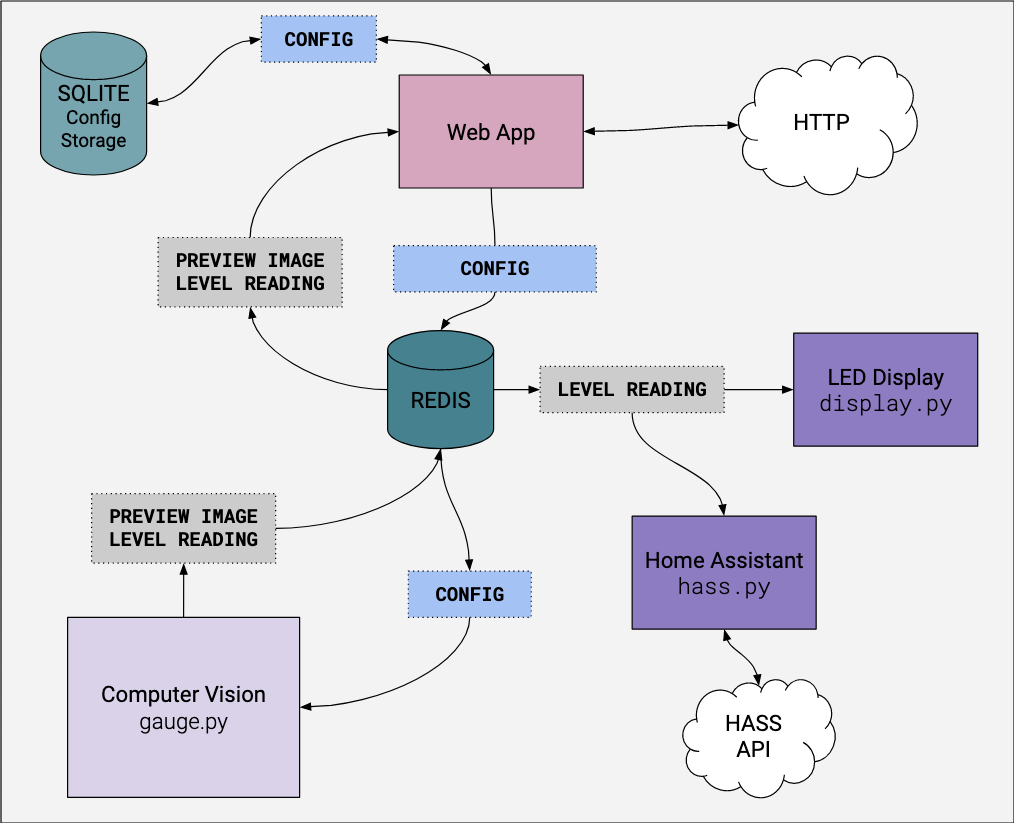
The software is primarily written in Python, and is split into distinct processes that each handle a specific function. Configuration parameters are stored in a SQLite3 database, and the software modules communicate with each other in a loosely coupled fashion using Redis. Redis is used to hold configuration data, level readings, and preview image data. Additionally the Redis pub/sub mechanism is used to signal events in the system.
The diagram below shows a rough overview of the various components of the system and how they interact.
Computer Vision (CV) module - gauge.py
This module is responsible for image capture and computer vision processing, producing a preview image and averaged gauge levels as output. The module is configured by a set of parameters which are pulled from Redis. These values are injected into Redis from the web app, discussed below.
This module runs in a continuous loop:
- Pulls fresh configuration values from Redis
- Captures a frame from the Pi camera in 800x608 resolution
- Performs a sequence of computer vision (CV) processing steps (called the pipeline) to find the pixel locations of the indicator and the percentage scale markings
- Interpolates the pixel locations of the indicator and scale markings, producing a percentage reading
- Averages many readings together to produce a final level output, and injects it into Redis
- Injects a JPEG-encoded tuning preview image into Redis every frame showing detected regions and other helpful data
- Publishes messages on Redis using the pub-sub mechanism to alert other modules that a new preview frame and/or level data are available
- Capture a frame from the camera
- Rotate the image to account for physical skew of the camera and gauge [configurable]
- Rotate the image 180 degrees, because the camera is installed upside down
- Scale Markings
- Crop a rectangle to find the scale markings [configurable]
- Convert the cropped scale image to grayscale
- Blur the grayscale image [configurable]
- Perform a threshold operation on the blurred image to find the scale markings [configurable]
- Invert the threshold scale image
- Find contours that represent the scale markings (should be exactly five)
- Level Indicator
- Crop a rectangle to find the indicator [configurable]
- Convert the cropped image to HSV colorspace
- Create a masked image by checking if pixels are in the red color range
- Blur the masked image [configurable]
- Convert the blurred image to grayscale
- Perform a threshold operation on the grayscale image to find the indicator [configurable]
- Find the contour that represents the indicator (should be exactly one)
- Calculate level using the detected contours and linear interpolation
- A bounding box for each contour is calculated, and 1/2 of the height (middle of the box) is used as the position of that object
- The contours of the scale markings are associated with values of 100%, 75%, 50%, 25% and 0% based on their sorted Y position
- A linear interpolation generates a percentage level based on the position of the indicator bounding boxes relative to the scale bounding boxes
Web App - webapp/
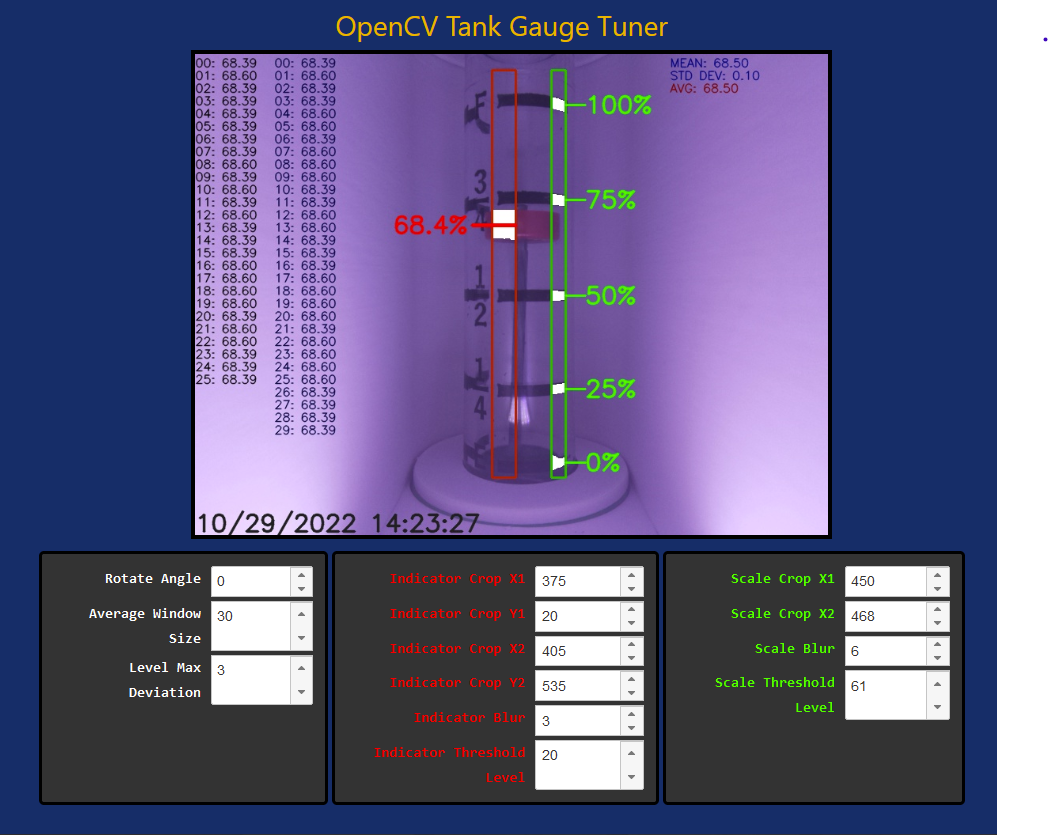
The web app is built around a Flask back-end and HTML5/JS front-end. The primary function is to provide a tuning interface, which shows a real-time preview of the camera image and provides various controls to adjust CV processing parameters. Additionally, a basic REST API is provided to allow query of current gauge level.
The web back-end connects with the SQLite3 database to retrieve and store configuration values. It also connects with Redis to inject config values, as well as query the current frame and level data. The back-end provides a basic image streaming endpoint that supplies JPEG-encoded frames to a client on a continuous basis, as they are produced. An endpoint is also provided which allows the front-end controls to modify configuration parameters, resulting in storage in the SQLite3 database as well as being injected into Redis.
Because the CV module continuously refreshes configuration values from Redis, the end result is that changes made on the tuning page are reflected in short order, and updated results can be seen on the preview image within a frame or two of making a change. This makes it a relatively intuitive process to tune the computer vision parameters.
See the Tuning Page for more detail on how the tuning process works.
Human-usable endpoints:
-
/- realtime streaming preview image with no controls -
/tune- tuning page with realtime streaming preview and tuning controls
REST API endpoints:
-
/api/set_config_value?id=KEY?value=VALUE- Sets a config KEY to specified VALUE. See the database schema for valid config keys and ranges. -
/api/shutdown?type=TYPE- Powers down or reboots the system depending on TYPE (rebootorhalt) -
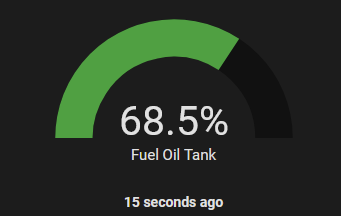
/api/get_level- Returns JSON data containing the last updated level and update time.
{
  "level": 67.9,
  "update_time": "2022-10-30 16:42:04.452717"
}
Internal endpoints include:
-
/video_feedprovides the contents for an<IMG/>tag, containing streamed JPG data. Used by the preview and tuning pages.
By default, the web app runs on port 8080.
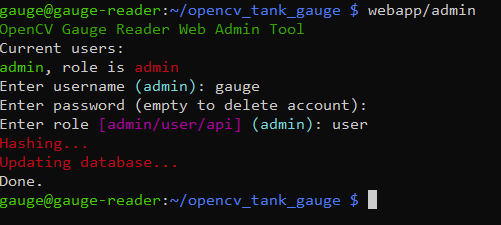
The web app implements basic authentication via username and password. The install script walks you through setting up an initial account.
To change account passwords, or add new accounts in the future, run the command line utility webapp/admin from a shell. This launches a simple command-line program to allow you to change the password or role of an existing account (or make a new account), or delete an existing account.
Supporting tokens for API endpoints would be a nice future addition, but this is not supported at this time. For now, if you need to access API endpoints and embed authentication, the terrible old trick of embedding credentials in the URL will work. e.g. http://user:[email protected]:8080/api/get_level
Normally the web app runs under gunicorn, but for iterating and testing during development, the built-in Flask web server can be used. Make sure the gauge-webapp service is stopped first. Activate the virtual environment, and then run:
python wsgi.py from the project root directory.
Display module - display.py
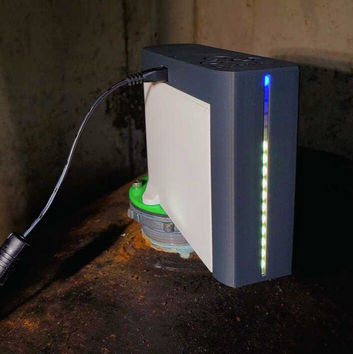
This simple module is responsible for driving NeoPixel-style WS2812 RGB LEDs to show simple animated LED patterns indicating status and tank level. The WS2812 LEDs are driven directly from a GPIO pin on the Pi, which is made possible by the Adafruit NeoPixel Pi Library. This library does some clever tricks to use hardware on the processor to produce stable timing output for the NeoPixel LEDs. In order to access the low-level hardware to accomplish this, this process must run as root - one of the main reasons it's split out from other components in this system.
This module runs in a continuous loop:
- Spin off a thread that generates simple LED animations based on system state and level data
- Main task listens on Redis for published messages that indicate new level data available
- When new data is available, update the LED thread with the new state and level information
Home Assistant module - hass.py
This module is responsible for updating Home Assistant with new tank level readings when they are published. It simply subscribes to the appropriate channel via Redis and waits for update messages. Whenever a new value is available, it uses the Home Assistant API to update a tank level sensor entity within Home Assistant.
More details are provided in the Home Assistant section.
A Virtual Environment (venv) is used to isolate the required Python packages and prevent them from potentially causing issues with the system-installed Python. One might argue that this is an unnecessary step for a dedicated embedded system, but it's easy to set up and low overhead, and considered best-practice.
The virtual environment is set up by the install script, and is located in ~/.venv in the user account that runs the software (gauge if following the installation instructions).
If you are logged into the Pi via SSH and want to run the gauge Python scripts from the command line, you need to first activate the virtual environment:
. ~/.venv/bin/activate
Your shell prompt will show that you're in the virtual environment with a prefix, e.g. (.venv) gauge@gauge-reader:~ $
To exit the virtual environment, simply execute deactivate from the command line.
The gauge reader software is split into several components, as discussed above. Unit files for each component are included in the systemd/ directory of the respository. Additionally, a helper script is included to install or remove the services. The install script runs this script automatically.
The following services are configured:
-
gauge.service- The primary service upon which the various subordinate services depend. Starting or stopping this service will cause the related services to also start or stop. -
gauge-cv.service- The computer vision service that managesgauge.py. This process runs as thegaugeuser. -
gauge-webapp.service- The web app service that manages running the webapp via gunicorn. The web app runs as thegaugeuser. -
gauge-hass.service- The Home Assistant service that manageshass.py. The HASS service runs as thegaugeuser. -
gauge-display.service- The NeoPixel display service that managesdisplay.py. This service must run asrootbecause it needs access to low-level hardware to drive the RGB LEDs.
The installation script installs and enables the services so that they come up automatically upon reboot. You can start or stop all pieces of the gauge reader system systemctl stop gauge or systemctl start gauge. You can also start or stop individual components, which can be helpful for development, e.g. systemctl stop gauge-cv. This would allow you to make changes to gauge.py and run the altered script from the command line (remember the virtual environment!), while systemd keeps the other pieces of the system running for testing.