Graphviz Rules Diagram - synthetichealth/synthea GitHub Wiki
NOTE: these rules and diagrams were generated using the Ruby version of Synthea; the Java version has no such concept of "rules" and as such this is no longer current. This page is left only for historical context.
Viewing Rules and Attributes Relationships
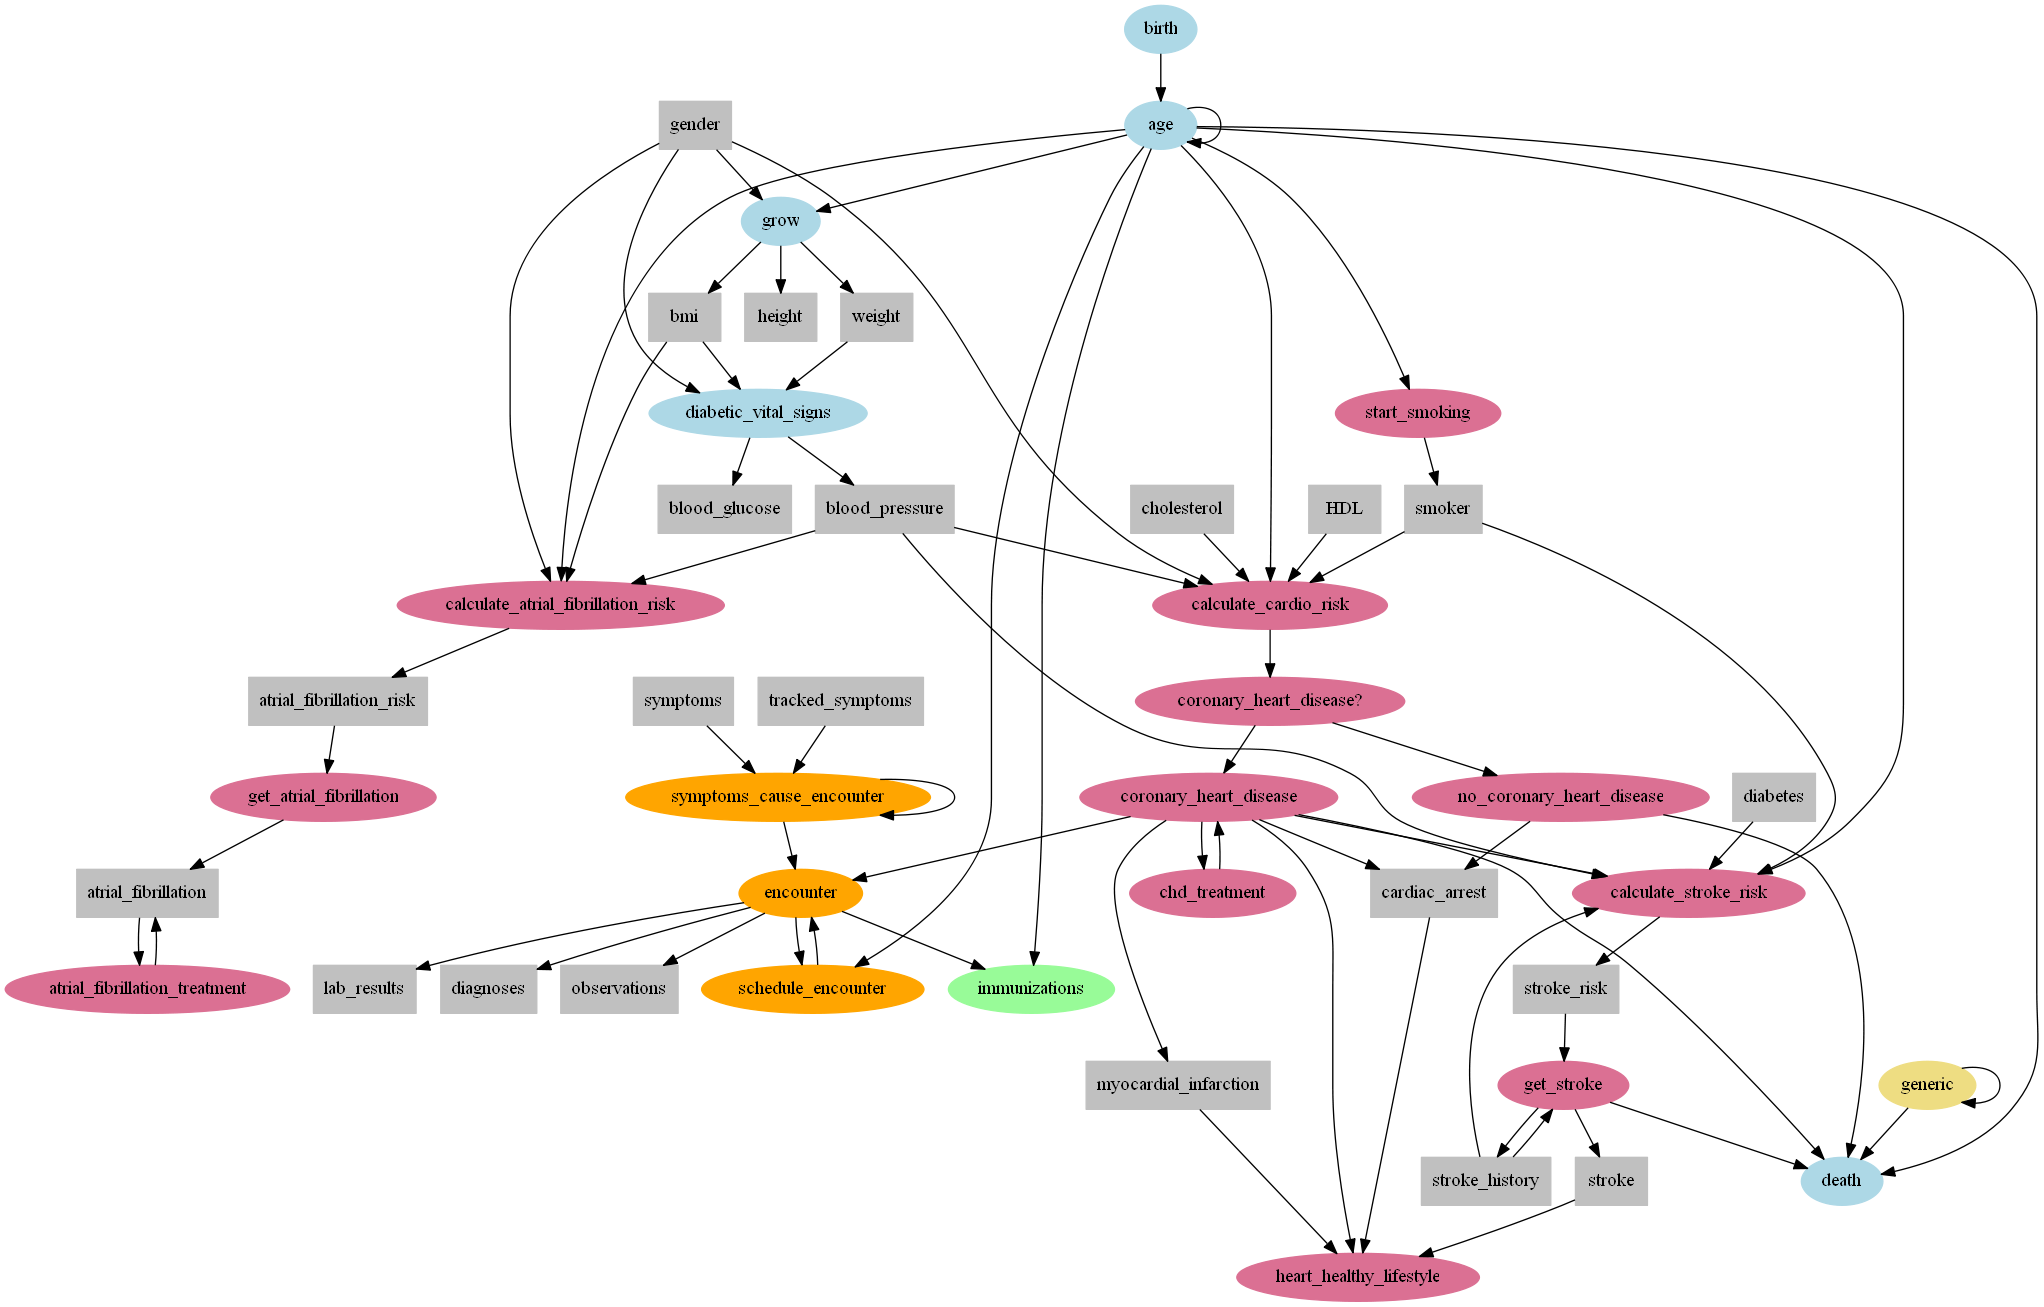
A diagram showing the relationships between various rules and attributes can be generated with Graphviz. Since there are so many rules and attributes being modeled in Synthea, it can often be useful to see a visual representation of how these different aspects interact with each other.
Running Synthea Graphviz
To generate the diagrams, GraphViz must first be installed. Then run the graphviz rake task.
brew install graphviz
bundle exec rake synthea:graphviz
The flowchart diagram will be generated in the output/graphviz folder, named synthea_rules.png.
Creating the rules relationships
The relationships for these rules and attributes are defined in the rule method calls in the modules lib/modules. For more information on the how to write and structure rules, see the Adding a Module Wiki page.
The inputs and outputs array arguments for a rule define its relationships. The symbols passed in the inputs arrays are the factors that affect the current rule, and can be either attributes or other rules. These are denoted in the diagram by an arrow pointing from the factor to the rule.
Symbols passed in the outputs arrays are attributes or rules that the rule determines. The diagram depicts these as arrows pointing from the current rule to these other attributes.