Homer_Data_integration - suimye/NGS_handson2015 GitHub Wiki
#Homerを用いたデータの統合
#####2016.2.現在versionがv4.8, 1-13-2016らしい。かなり新しい。
Homerのページは迷子になりやすいので、直リンク。
- HOMERのinstall
- peakをmergeする。
- peak情報のregionについて再カウントして変動peak解析
- mergeしたpeakにannotationする。
requirementについては詳しく説明しないので、xcodeなどインストールされていることを確かめてから実行する。
homer folderをinstallしたいところにつくる、下記ではすでに~/binというfolderが存在し、その中に各種の実行ファイルをインストールしていっているので、このbinフォルダにhomer専用のfolderを作っておいて、pathを通して利用することにする
mkdir ~/bin/homer
cd ~/bin/homer
chmod 755 configureHomer.pl ./configureHomer.pl -install
あらかじめ、MACSなどのpeak call softwareで出力した複数のpeakデータ (bedファイル)を融合させ、peak間で一致する領域や不一致な領域を調べて1つのファイルにしておく。
mergePeaks -d
- -d: peak領域の広さを指定する(defaltでは、"given"で、与えられたpeakの大きさのまま使う。基本的にこれ以外は選ばない方が良い)。
- -venn: ベン図用overlap数のtable
- -prefix: データを各オーバーラップデータごとに分けて出力する。その際の命名規則を入れる ここでは"uq"
- -matrix: 2つのデータ間のpeakのオーバーラップの共起頻度について統計量を計算してくれる。この計算にはゲノムサイズが重要なので、-gsize (最新版では-g)で与えてあげる(defaltでは、2億になっている)。
以上のように色々な出力が得られるが、まずは、MACS由来のpeak.bedファイルは、普通のbedファイルの順序になっていないので、ワンライナーで変換する。
####bedファイルに変換する
cat Ctrl_H3K9K14Ac.after.bam_peaks.bed |perl -e 'while(<>){chomp; @array=split/\t/; print "chr$array[0]\t$array[1]\t$array[2]\t$array[4]\t$array[3]\n"}'> Ctrl_H3K9K14Ac.mspeaks.bed
cat TSA_H3K9K14Ac.after.bam_peaks.bed |perl -e 'while(<>){ chomp; @array=split/\t/; print "chr$array[0]\t$array[1]\t$array[2]\t$array[4]\t$array[3]\n"}'>TSA_H3K9K14Ac.mspeaks.bed
cat SAHA_H3K9K14Ac.after.bam_peaks.bed |perl -e 'while(<>){chomp; @array=split/\t/; print "chr$array[0]\t$array[1]\t$array[2]\t$array[4]\t$array[3]\n"}'>SAHA_H3K9K14Ac.mspeaks.bed
#HOMER bed形式にする
bed2pos.pl Ctrl_H3K9K14Ac.mspeaks.bed >Ctrl_H3K9K14Ac.mspeaks.hb
bed2pos.pl TSA_H3K9K14Ac.mspeaks.bed >TSA_H3K9K14Ac.mspeaks.hb
bed2pos.pl SAHA_H3K9K14Ac.mspeaks.bed >SAHA_H3K9K14Ac.mspeaks.hb
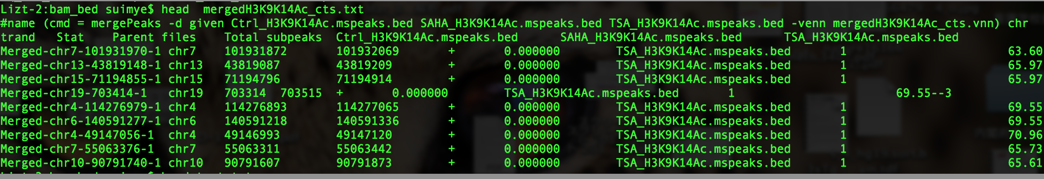
#####次に、3つのデータから、peakのみつかる全ての領域についての情報を1つのファイルで得る。
mergePeaks -d given Ctrl_H3K9K14Ac.mspeaks.hb TSA_H3K9K14Ac.mspeaks.hb SAHA_H3K9K14Ac.mspeaks.hb >mergedH3K9K14Ac_cts.txt
#####この出力データは、Homer独自のbed形式になっているので、必要に応じて通常のbed形式などにしてGREATや、ChIP-MEMEへ用いる(先頭がpeakのID等)。
cat mergedH3K9K14Ac_cts.txt |perl -e 'while(<>){chomp; @array=split/\t/; print "$array[1]\t$array[2]\t$array[3]\t$array[0]\n"}'> all.mergedH3K9K14Ac_cts.bed

tail -n +2 all.mergedH3K9K14Ac_cts.bed > all.mergedH3K9K14Ac_cts.nh.bed
####その他全てを出力する。
この出力は、
- ベン図の作成
- サンプル間のpeakの類似性についてグローバルに見る指標をくれる
- filename.logPvalue.matrix.txt (超幾何分布に基づく対数変換p_value)
- filename.logRatio.matrix.txt (期待値に対する倍差の対数変換値)
- filename.count.matrix.txt (超過分布のために利用したカウント数)
等を出力できる。
mergePeaks -d given Ctrl_H3K9K14Ac.mspeaks.bed TSA_H3K9K14Ac.mspeaks.bed SAHA_H3K9K14Ac.mspeaks.bed -prefix uq -matrix mergedH3K9K14Ac.matrix.txt -gsize 3e9
######ヒトのゲノムサイズにあわせ 3e9とした。
##2. Peakの変動解析getDifferentialPeaks
peak領域情報に対して、与えたファイルからタグ数を計算してくれる。
getDifferentialPeaks [options]
手順
- makeTagDirectoryコマンドを用いて、比較サンプルごとに、tagディレクトリを作る
- getDifferentialPeaksを使う
####tagディレクトリを作る必要がある。tag fileはbedでもbamでもOK
makeTagDirectory Ctrl_H3K9K14Ac Ctrl_H3K9K14Ac.drm.blst.rmsk.bam makeTagDirectory SAHA_H3K9K14Ac SAHA_H3K9K14Ac.drm.blst.rmsk.bam makeTagDirectory TSA_H3K9K14Ac TSA_H3K9K14Ac.drm.blst.rmsk.bam makeTagDirectory Treat_H3K9K14Ac SAHA_H3K9K14Ac.drm.blst.rmsk.bam TSA_H3K9K14Ac.drm.blst.rmsk.bam makeTagDirectory All_H3K9K14Ac Ctrl_H3K9K14Ac.drm.blst.rmsk.bam SAHA_H3K9K14Ac.drm.blst.rmsk.bam TSA_H3K9K14Ac.drm.blst.rmsk.bam
Lizt-2:bam_bed suimye$  makeTagDirectory Ctrl_H3K9K14Ac Ctrl_H3K9K14Ac.drm.blst.rmsk.bam
	Will parse file: Ctrl_H3K9K14Ac.drm.blst.rmsk.bam

	Creating directory: Ctrl_H3K9K14Ac and removing existing *.tags.tsv

	Treating Ctrl_H3K9K14Ac.drm.blst.rmsk.bam as a bam file

	Lizt-2:bam_bed suimye$ makeTagDirectory SAHA_H3K9K14Ac SAHA_H3K9K14Ac.drm.blst.rmsk.bam
	Will parse file: SAHA_H3K9K14Ac.drm.blst.rmsk.bam

	Creating directory: SAHA_H3K9K14Ac and removing existing *.tags.tsv

	Treating SAHA_H3K9K14Ac.drm.blst.rmsk.bam as a bam file
	Reading alignment file SAHA_H3K9K14Ac.drm.blst.rmsk.bam

	Optimizing tag files...
	Estimated genome size = 3094032718
	Estimated average read density = 0.006187 per bp
	Total Tags = 19143704.0
	Total Positions = 19143704
	Average tag length = 36.0
	Median tags per position = 1 (ideal: 1)
	Average tags per position = 1.000
	Fragment Length Estimate: 148
	Peak Width Estimate: 103
		!!! No reliable estimate for peak size
		Setting Peak width estimate to be equal to fragment length estimate
	Autocorrelation quality control metrics:
		Same strand fold enrichment: 1.2
		Diff strand fold enrichment: 1.2
		Same / Diff fold enrichment: 1.0

		Guessing sample is ChIP-Seq - may have low enrichment with lots of background


Lizt-2:bam_bed suimye$  makeTagDirectory Ctrl_H3K9K14Ac Ctrl_H3K9K14Ac.drm.blst.rmsk.bam
	Will parse file: Ctrl_H3K9K14Ac.drm.blst.rmsk.bam

	Creating directory: Ctrl_H3K9K14Ac and removing existing *.tags.tsv

	Treating Ctrl_H3K9K14Ac.drm.blst.rmsk.bam as a bam file
	Reading alignment file Ctrl_H3K9K14Ac.drm.blst.rmsk.bam

	Optimizing tag files...
	Estimated genome size = 3094044930
	Estimated average read density = 0.006940 per bp
	Total Tags = 21473086.0
	Total Positions = 21473086
	Average tag length = 36.0
	Median tags per position = 1 (ideal: 1)
	Average tags per position = 1.000
	Fragment Length Estimate: 144
	Peak Width Estimate: 155
	Autocorrelation quality control metrics:
		Same strand fold enrichment: 1.5
		Diff strand fold enrichment: 1.5
		Same / Diff fold enrichment: 1.0

		Guessing sample is ChIP-Seq or unstranded RNA-Seq - autocorrelation looks good.
Lizt-2:bam_bed suimye$ makeTagDirectory SAHA_H3K9K14Ac SAHA_H3K9K14Ac.drm.blst.rmsk.bam
	Will parse file: SAHA_H3K9K14Ac.drm.blst.rmsk.bam

	Creating directory: SAHA_H3K9K14Ac and removing existing *.tags.tsv

	Treating SAHA_H3K9K14Ac.drm.blst.rmsk.bam as a bam file
	Reading alignment file SAHA_H3K9K14Ac.drm.blst.rmsk.bam

	Optimizing tag files...
	Estimated genome size = 3094032718
	Estimated average read density = 0.006187 per bp
	Total Tags = 19143704.0
	Total Positions = 19143704
	Average tag length = 36.0
	Median tags per position = 1 (ideal: 1)
	Average tags per position = 1.000
	Fragment Length Estimate: 148
	Peak Width Estimate: 103
		!!! No reliable estimate for peak size
		Setting Peak width estimate to be equal to fragment length estimate
	Autocorrelation quality control metrics:
		Same strand fold enrichment: 1.2
		Diff strand fold enrichment: 1.2
		Same / Diff fold enrichment: 1.0

		Guessing sample is ChIP-Seq - may have low enrichment with lots of background
###2. getDifferentialPeaksを用いた結合変動解析
getDifferentialPeaks all.mergedH3K9K14Ac_cts.nh.bed Ctrl_H3K9K14Ac TSA_H3K9K14Ac -size given -F 1.2 -P 0.05 >CtrlvsTSA.diff.txt
#####結果、残念ながらdifferential peakはこのデータではみつからなかった。上のlogにもあるように、TSAとSAHAのデータは、ノイズレベルで低い。Acでのpeak callはあまりよろしいとはいえないので、H3K4me3などでやれば有意差でるでしょう。
- General Options:
-
-F 4.0 (バックグラウンドに対するfold enrichmentを入力, default: 4.0) -
-P 0.0001 (バックグラウンドに対するpoisson enrichment p-value, default: 0.0001) -
-same (異なるpeakではなく変わらないpeakを出力) -
-rev (targetではなく、コントロール側にenrichmentが見られる場合も出力) -
-size <#> (タグカウントするpeak周囲の領域サイズ, default: -fixed) -
-fixed (Count tags relative to actual peak start and stop, default) -
"-size given" is the same as "-fixed"
##3. Peakに遺伝子アノテーションを作成 annotatePeaks.plでは、次にGO解析や、遺伝子発現データとの結合、異なるデータからTagDensityの計算、motifの頻度解析まで可能
#####anntotation dataのダウンロード
perl /Users/suimye/tools/Homer/.//configureHomer.pl -install hg19
annotatePeaks.pl mergedH3K9K14Ac_cts.txt hg19 >mergedH3K9K14Ac_cts.annotated.txt
Lizt-2:bam_bed suimye$ annotatePeaks.pl mergedH3K9K14Ac_cts.txt hg19 >mergedH3K9K14Ac_cts.annotated.txt

	Peak file = mergedH3K9K14Ac_cts.txt
	Genome = hg19
	Organism = human
	Peak/BED file conversion summary:
		BED/Header formatted lines: 0
		peakfile formatted lines: 46092
		Duplicated Peak IDs: 0

	Peak File Statistics:
		Total Peaks: 46092
		Redundant Peak IDs: 0
		Peaks lacking information: 0 (need at least 5 columns per peak)
		Peaks with misformatted coordinates: 0 (should be integer)
		Peaks with misformatted strand: 0 (should be either +/- or 0/1)

	Peak file looks good!

	Reading Positions...
	-----------------------
	Finding Closest TSS...
	Annotating:........................
		Annotation	Number of peaks	Total size (bp)	Log2 Enrichment
		3UTR	460.0	22165125	0.478
		miRNA	3.0	75132	1.422
		ncRNA	258.0	5570971	1.636
		TTS	717.0	29060672	0.728
		pseudo	72.0	1880281	1.362
		Exon	1447.0	34639875	1.487
		Intron	22155.0	1213103438	0.294
		Intergenic	15352.0	1751759752	-0.766
		Promoter	4928.0	32425481	3.350
		5UTR	699.0	2562415	4.194
		snoRNA	0.0	273	-15.492
		snRNA	0.0	11	-15.492
	NOTE: If this part takes more than 2 minutes, there is a good chance
		your machine ran out of memory: consider hitting ctrl+C and rerunning
		the command with "-noann"
	To capture annotation stats in a file, use "-annStats <filename>" next time
	Annotating:........................
		Annotation	Number of peaks	Total size (bp)	Log2 Enrichment
		3UTR	460.0	22165260	0.479
		Other	1.0	3956599	-5.881
		Unknown?	0.0	18108	-15.492
		RNA	1.0	114882	-0.775
		miRNA	3.0	75132	1.423
		ncRNA	258.0	5570971	1.637
		TTS	717.0	29060672	0.728
		LINE	2685.0	624382609	-1.792
		LINE?	0.0	10448	-15.492
		srpRNA	2.0	254724	-0.923
		SINE	2231.0	380670607	-1.345
		RC	3.0	443176	-1.137
		tRNA	9.0	92892	2.702
		DNA?	2.0	264766	-0.979
		pseudo	72.0	1880281	1.363
		DNA	697.0	96078819	-1.038
		Exon	1447.0	34639875	1.488
		Intron	15437.0	643001254	0.689
		Intergenic	9308.0	893334583	-0.515
		Promoter	4925.0	32425481	3.350
		5UTR	697.0	2562415	4.191
		snoRNA	0.0	273	-15.492
		LTR?	0.0	21148	-15.492
		scRNA	3.0	116587	0.789
		CpG-Island	3398.0	9210763	4.631
		Low_complexity	146.0	15487417	-0.660
		LTR	1901.0	260168026	-1.027
		Simple_repeat	203.0	24910525	-0.870
		snRNA	10.0	322724	1.057
		Unknown	21.0	1250018	0.174
		SINE?	1.0	43068	0.641
		Satellite	1423.0	12364374	2.950
		rRNA	30.0	162674	3.630
	Counting Tags in Peaks from each directory...
	Organism: human
	Loading Gene Informaiton...
	Outputing Annotation File...
	Done annotating peaks file