Receiver Simulation - softerhardware/Hermes-Lite2 GitHub Wiki
This page presents simulation results for the Hermes-Lite2 receiver. These are simulations of Verilog RTL modules that are used in the FPGA gateware. The intent is to confirm that the Verilog RTL is producing expected results given the finite integers and opportunity for truncation, lost bits and other mistakes in the Verilog RTL. This is not a general DSP modeling methodology as it requires more lines of code and simulation time. Tools such as NumPy with SciPy, MATLAB or GNU Octave are more suitable for high-level DSP algorithm modeling and development.
The entirely open source simulation methodology uses MyHDL and Verilog RTL co-simulation. The Icarus Verilog simulator is used to simulate the Hermes-Lite2 Verilog RTL. NumPy with SciPy and pyFFTW as well as matplotlib are used to create stimuli, check results and create plots. See the end of this wiki page for help on repeating these experiments.
Maximum Strength Signal
This test presents a full-scale synthesized 5.02 MHz sine wave to the receiver Cordic. The Cordic is tuned to 5 MHz and includes a mixer/multiplier. The complex data from the Cordic is then passed through a fixed decimate by 8 CIC filter and then another variable CIC set to decimate by 12. This corresponds to the Hermes-Lite gateware with a 73.728 MHz clock (may be set to 76.8 for Hermes-Lite2) and 96 kHz receiver bandwidth.
14-Bit CIC to VARCIC Path
The original RTL used 14-bit wide I and Q data connections from the first CIC to the variable CIC. There has been discussion that this width is not enough and data is lost here for the lowest amplitude signals.
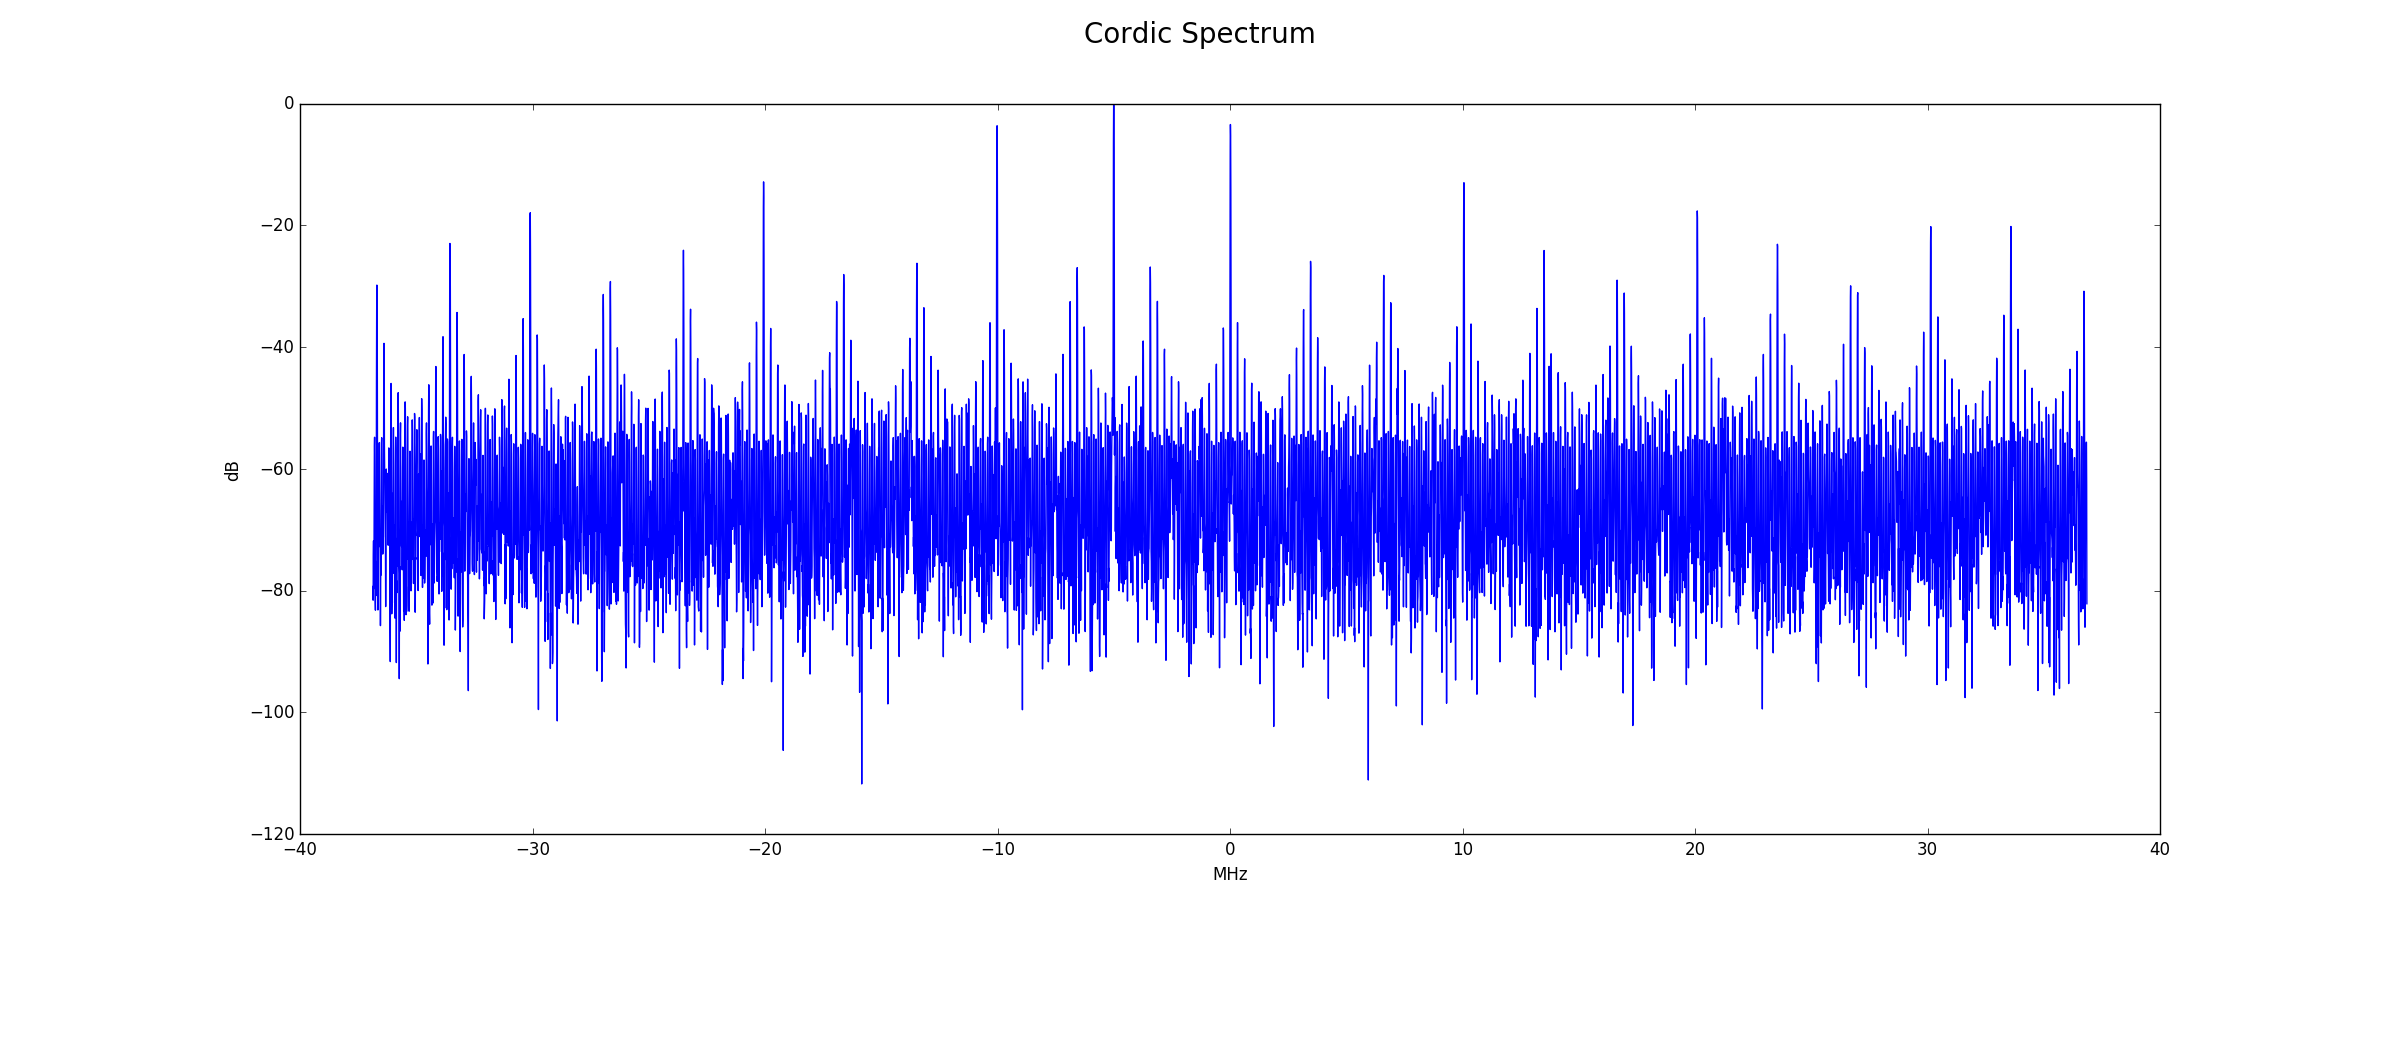
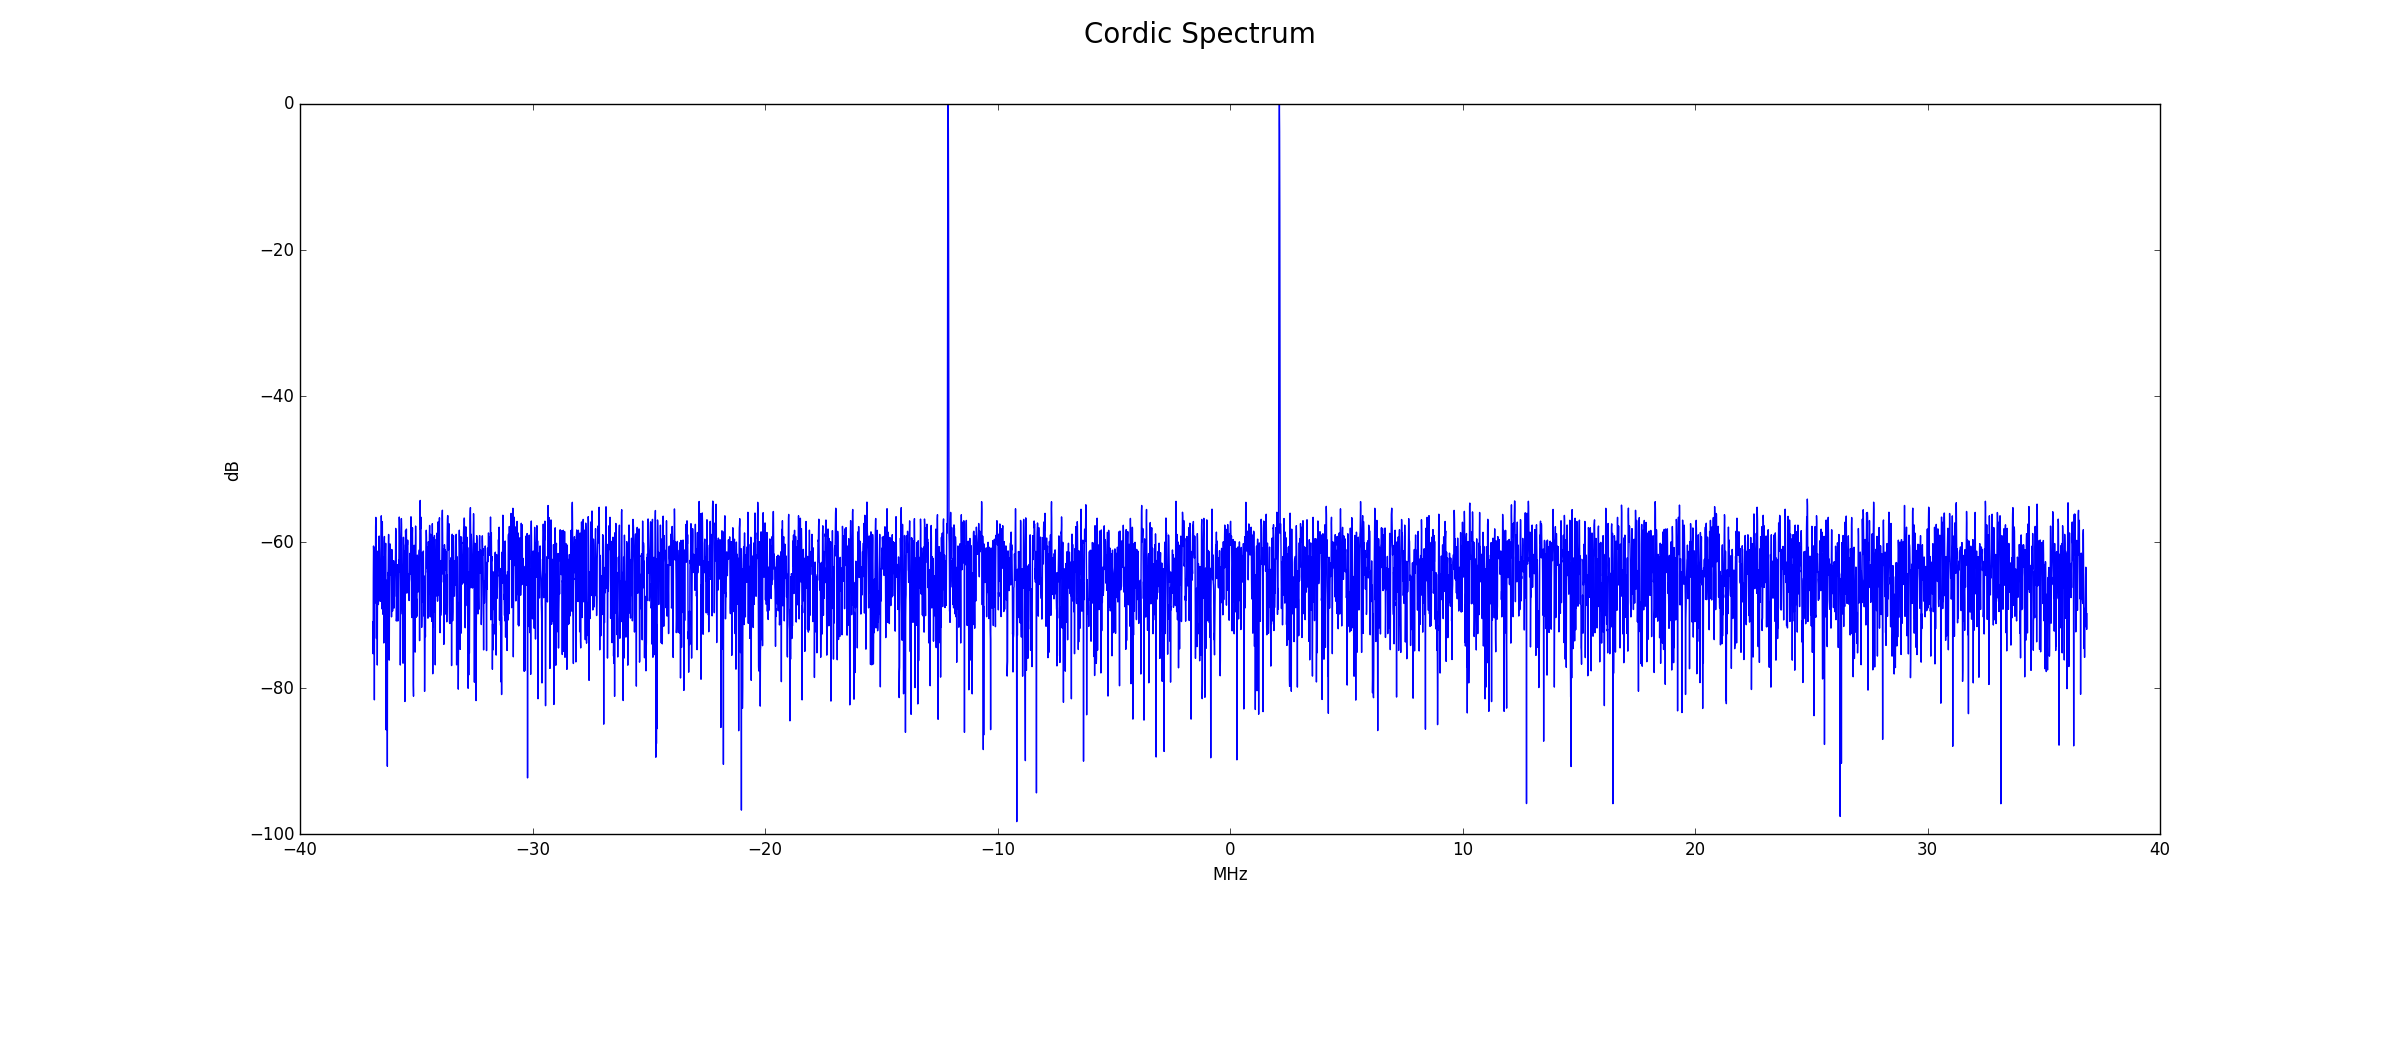
Cordic Output
Below is the frequency spectrum at the Cordic output. Since the synthetic input is not complex IQ to model the real ADC, there are two images of the signal of interest at -5.0MHz+5.02MHz=0.02MHz and -5.0MHz-5.02MHz=-10.02MHz. After filtering, only the image at 20kHz will remain. Processing gain is 39.1 dB for the FFT only. The expected noise floor is 74 (for full-scale 12-bit synthetic signal) + 39.1 = 113.1 dB and is in good agreement with the plot. Right-click and open any plot in a separate tab for a larger view.

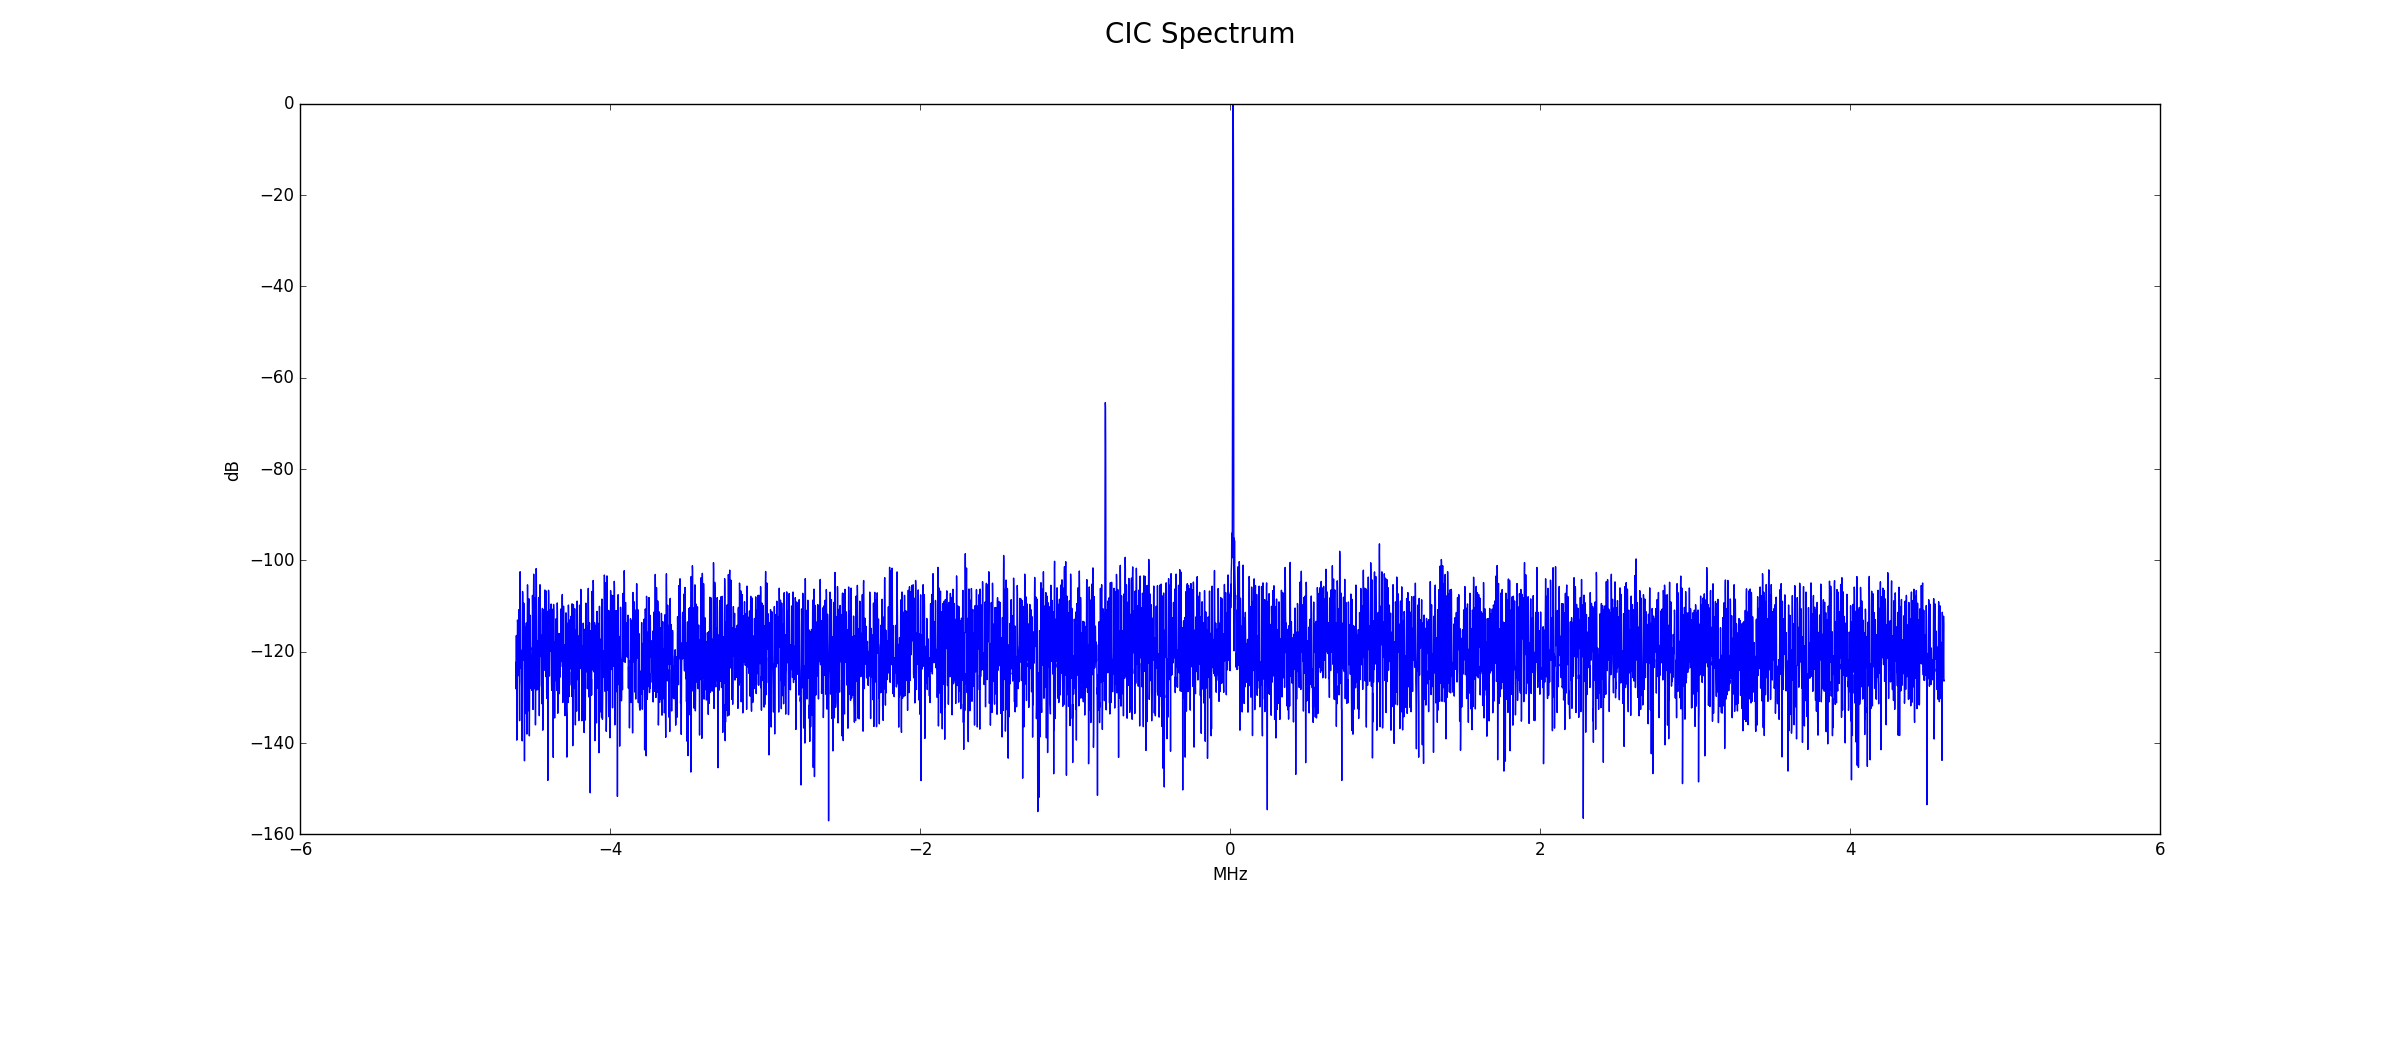
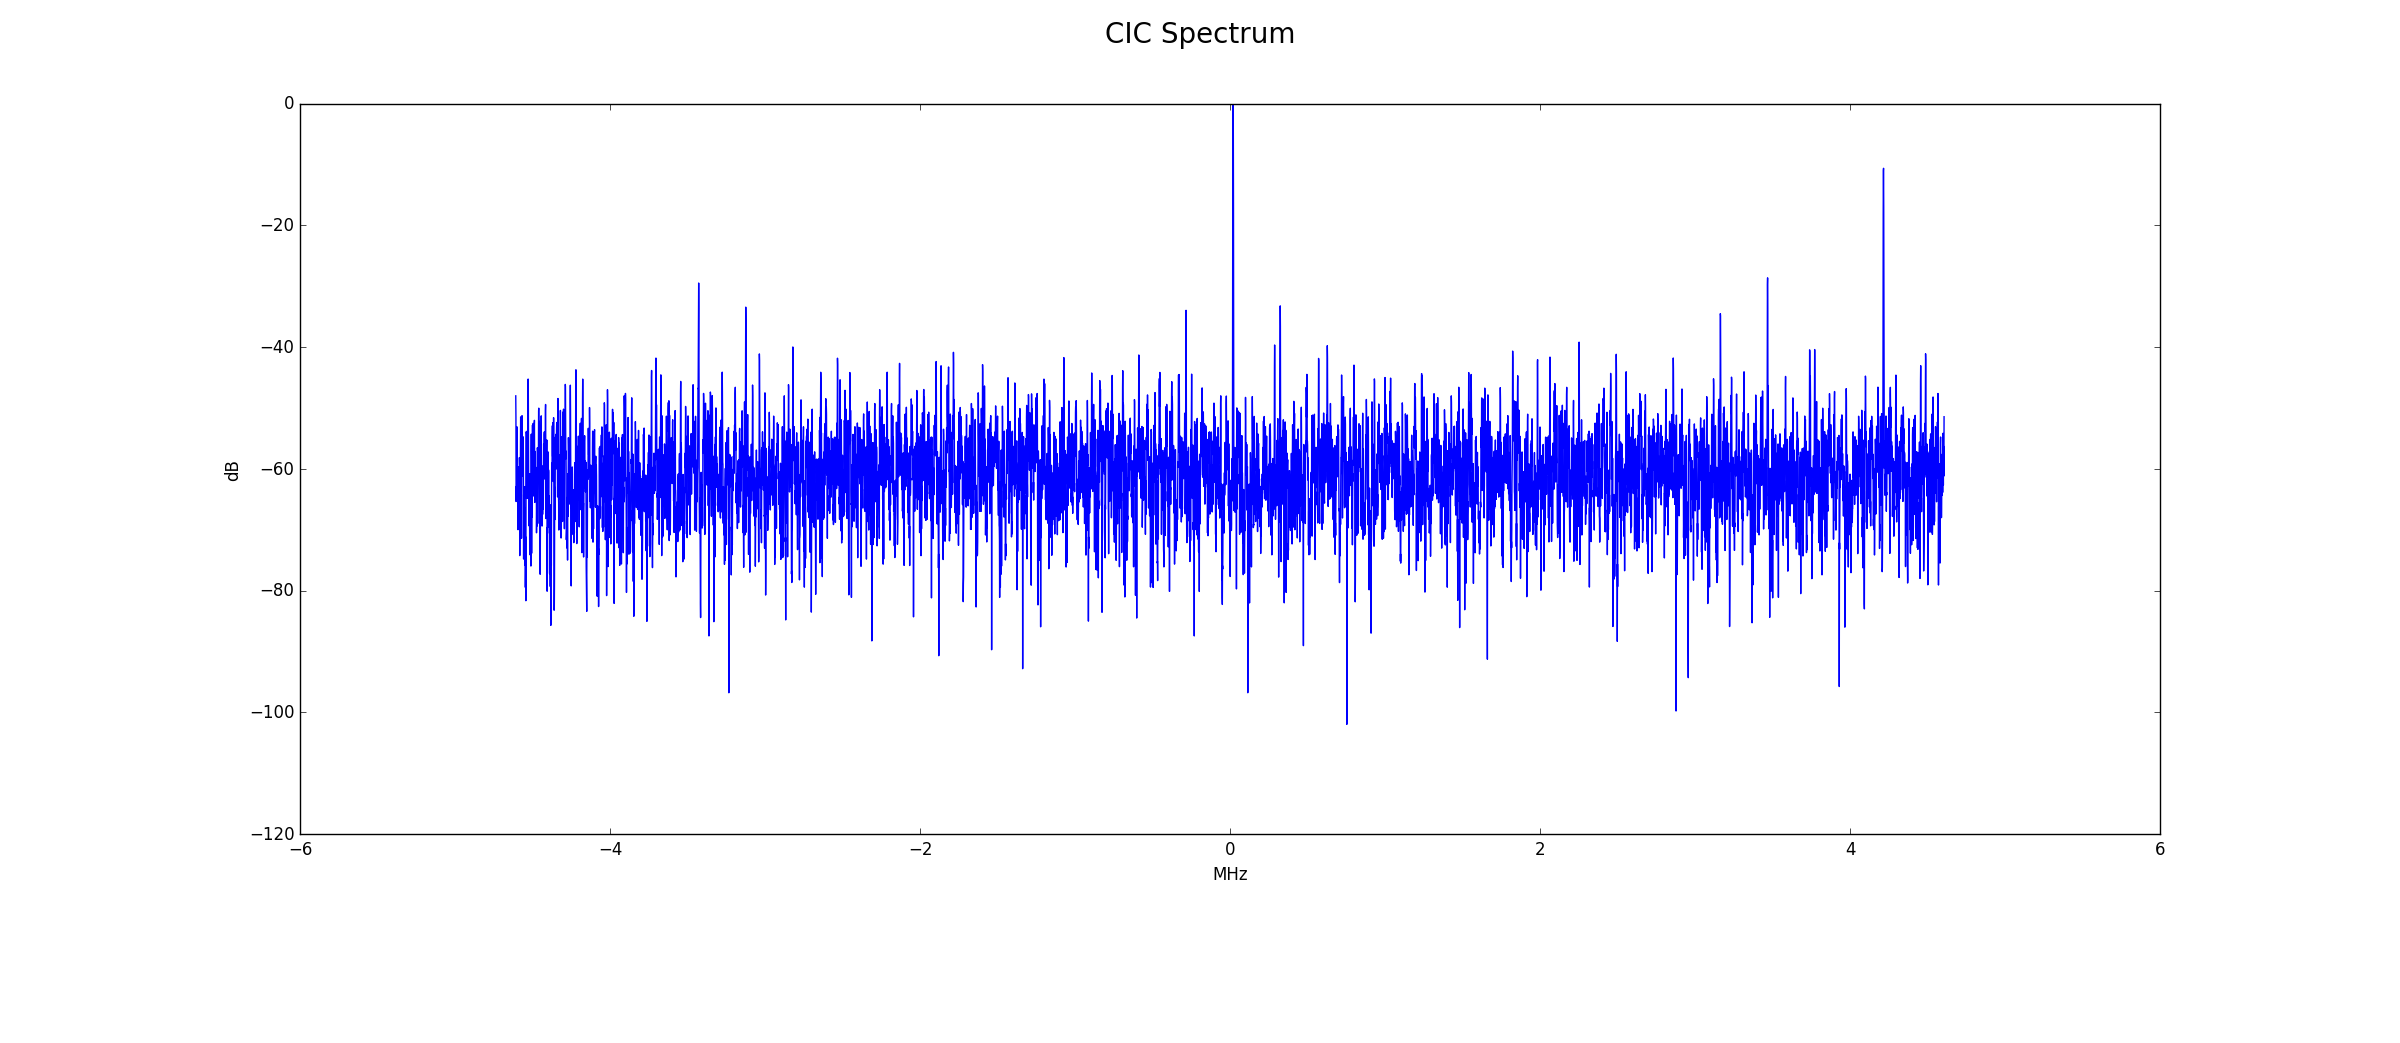
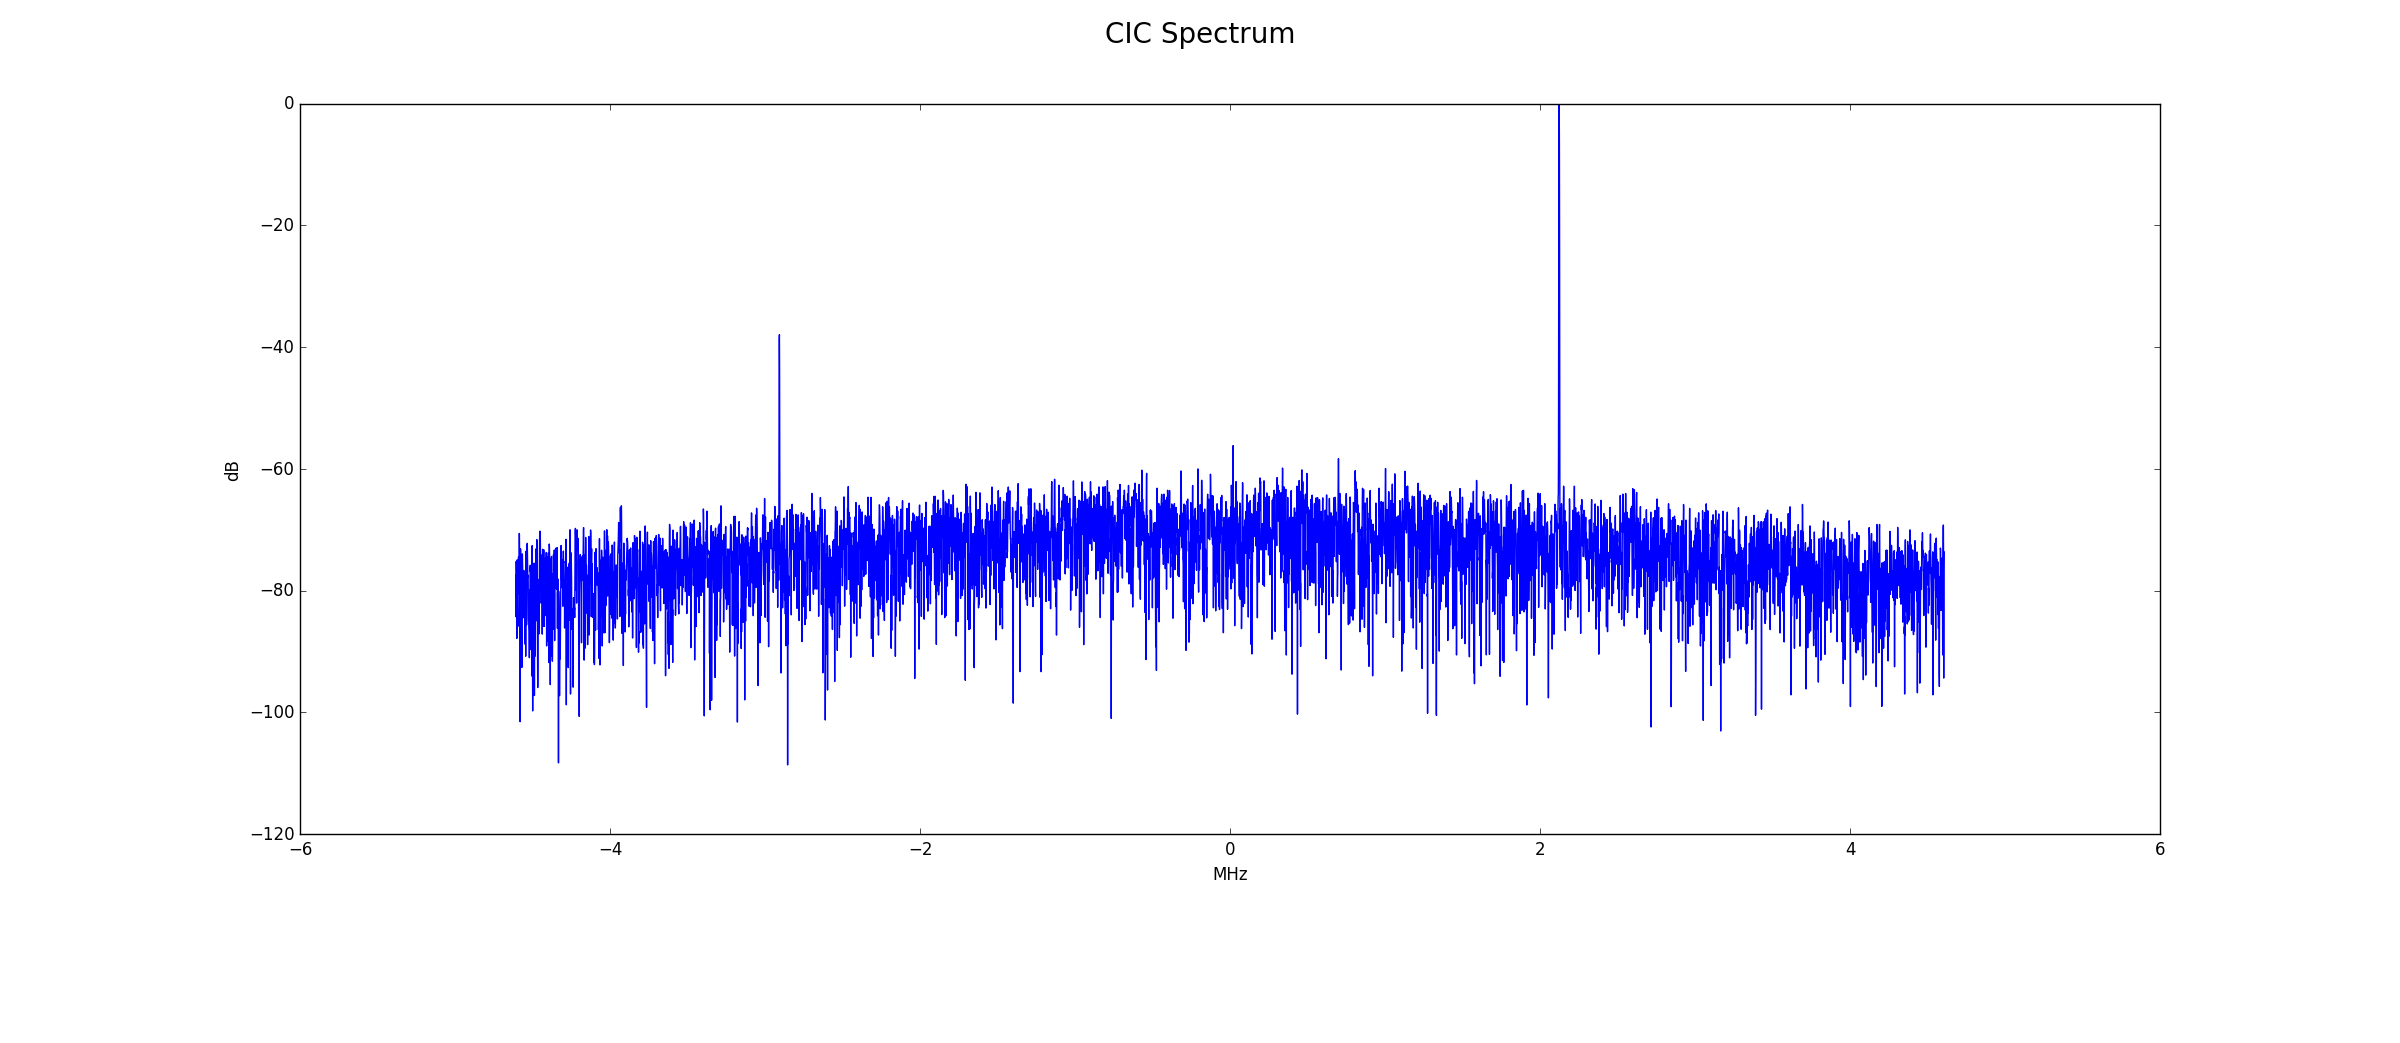
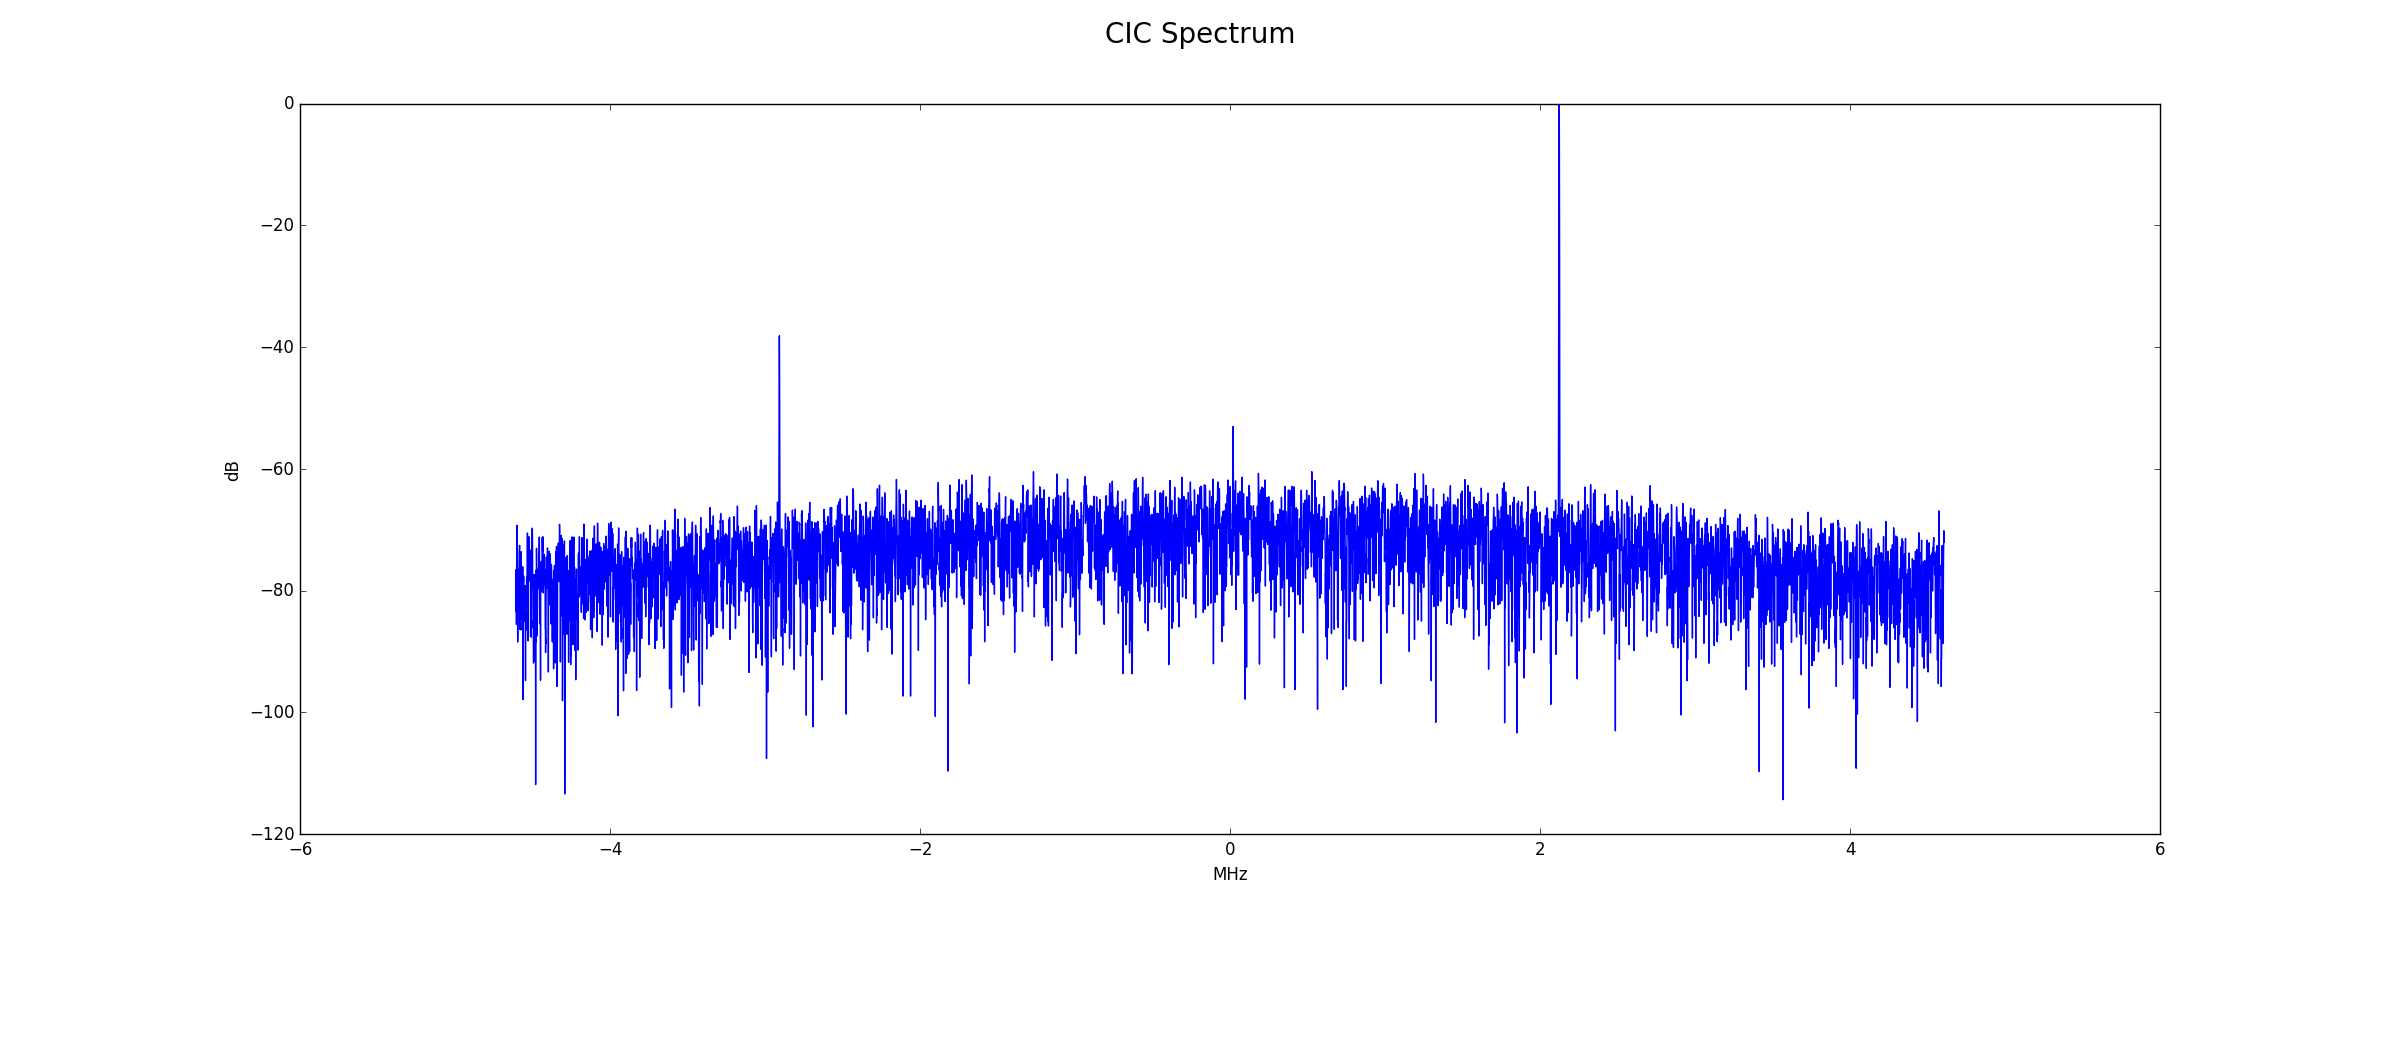
CIC Output
Below is the frequency spectrum at the fixed decimate by 8 CIC output. Processing gain is 39.1 dB for the FFT and 9.0 dB for the filters. The expected noise floor is 74+39.1+9.0=122.1 dB. Note the spur at -800 kHz, probably due to the full amplitude of the test signal. This will be filtered out.
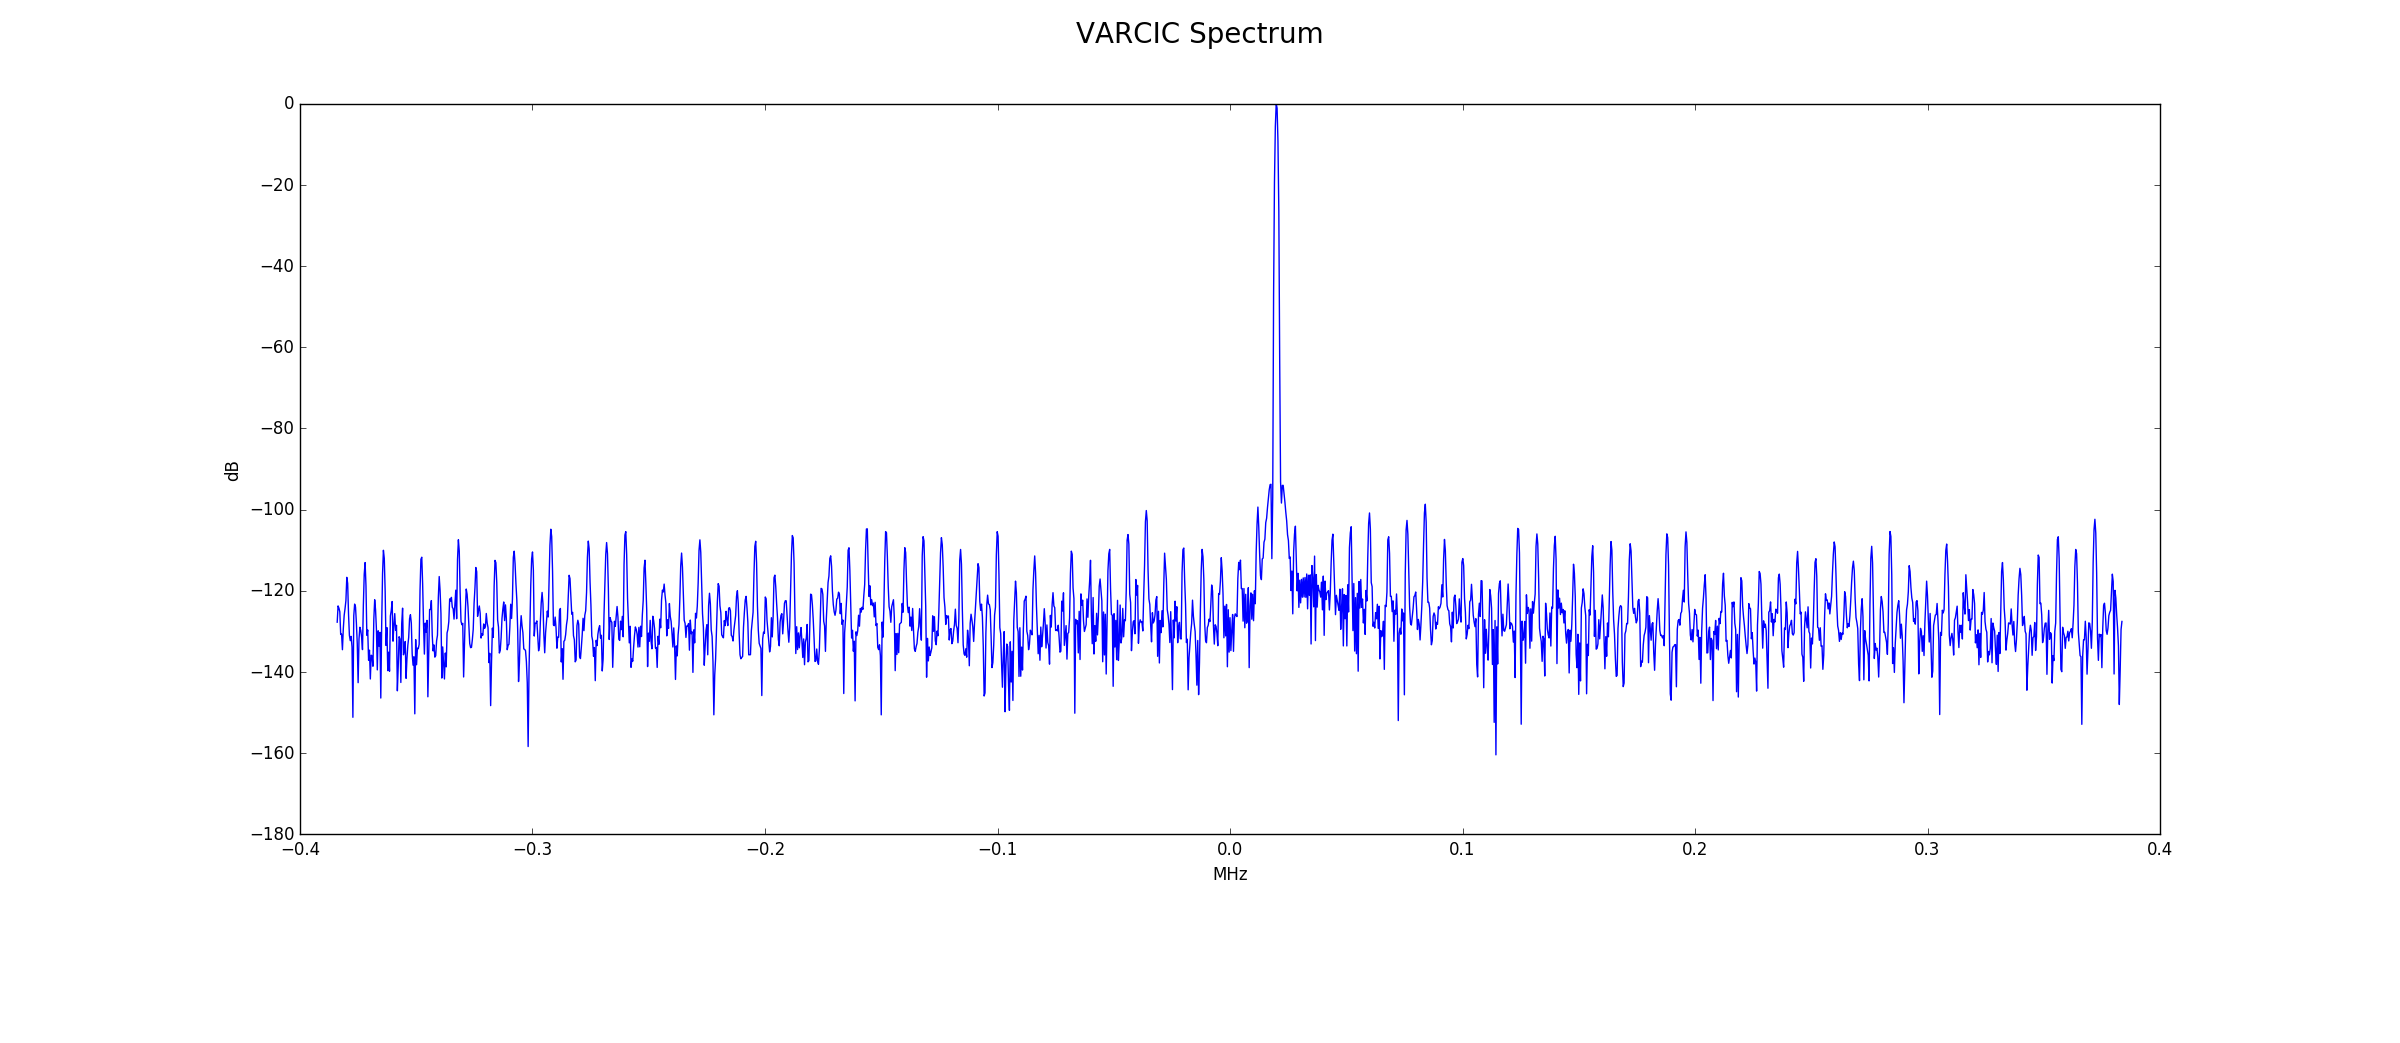
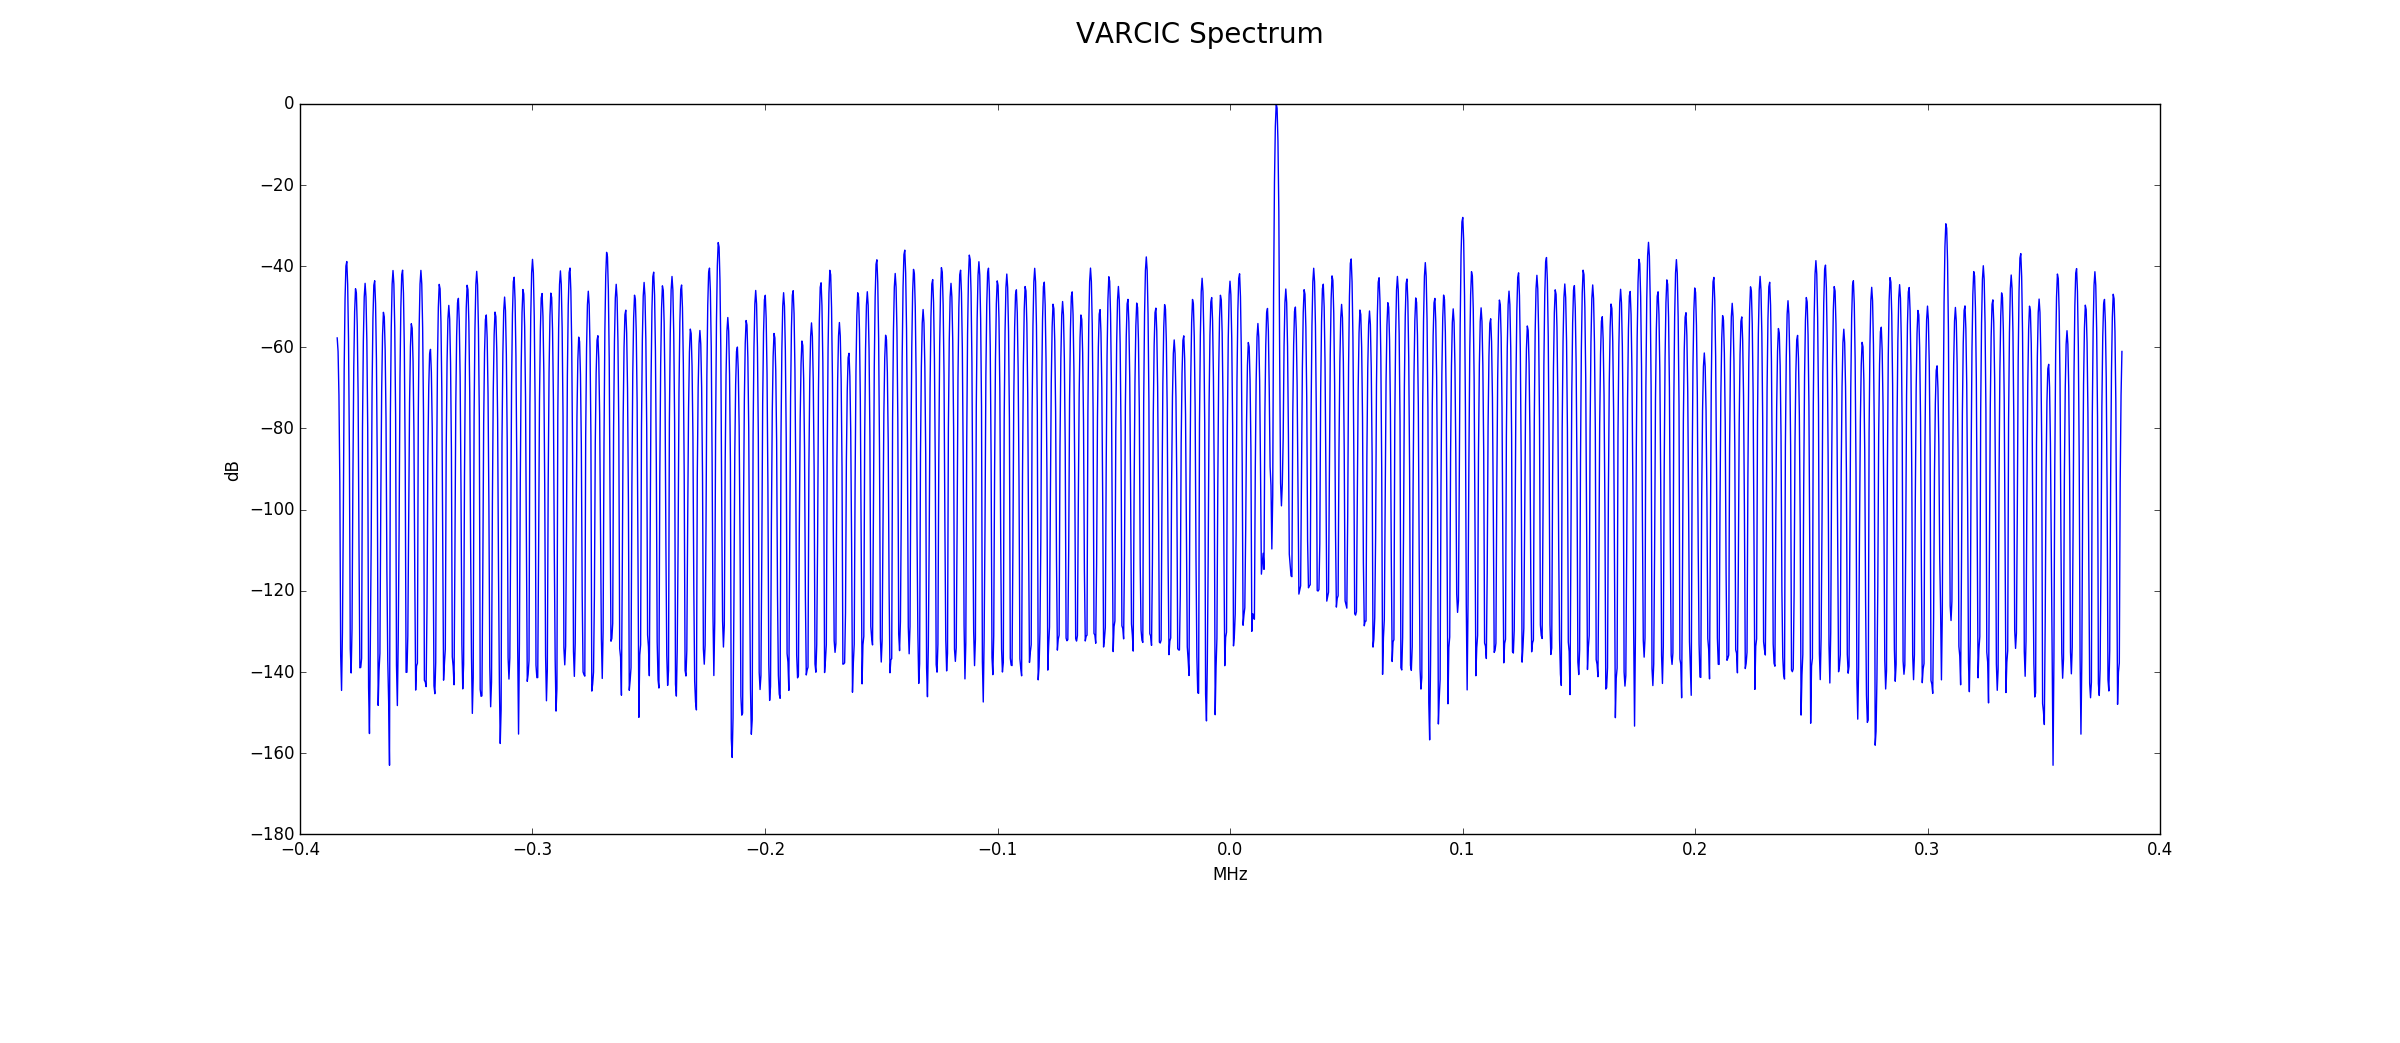
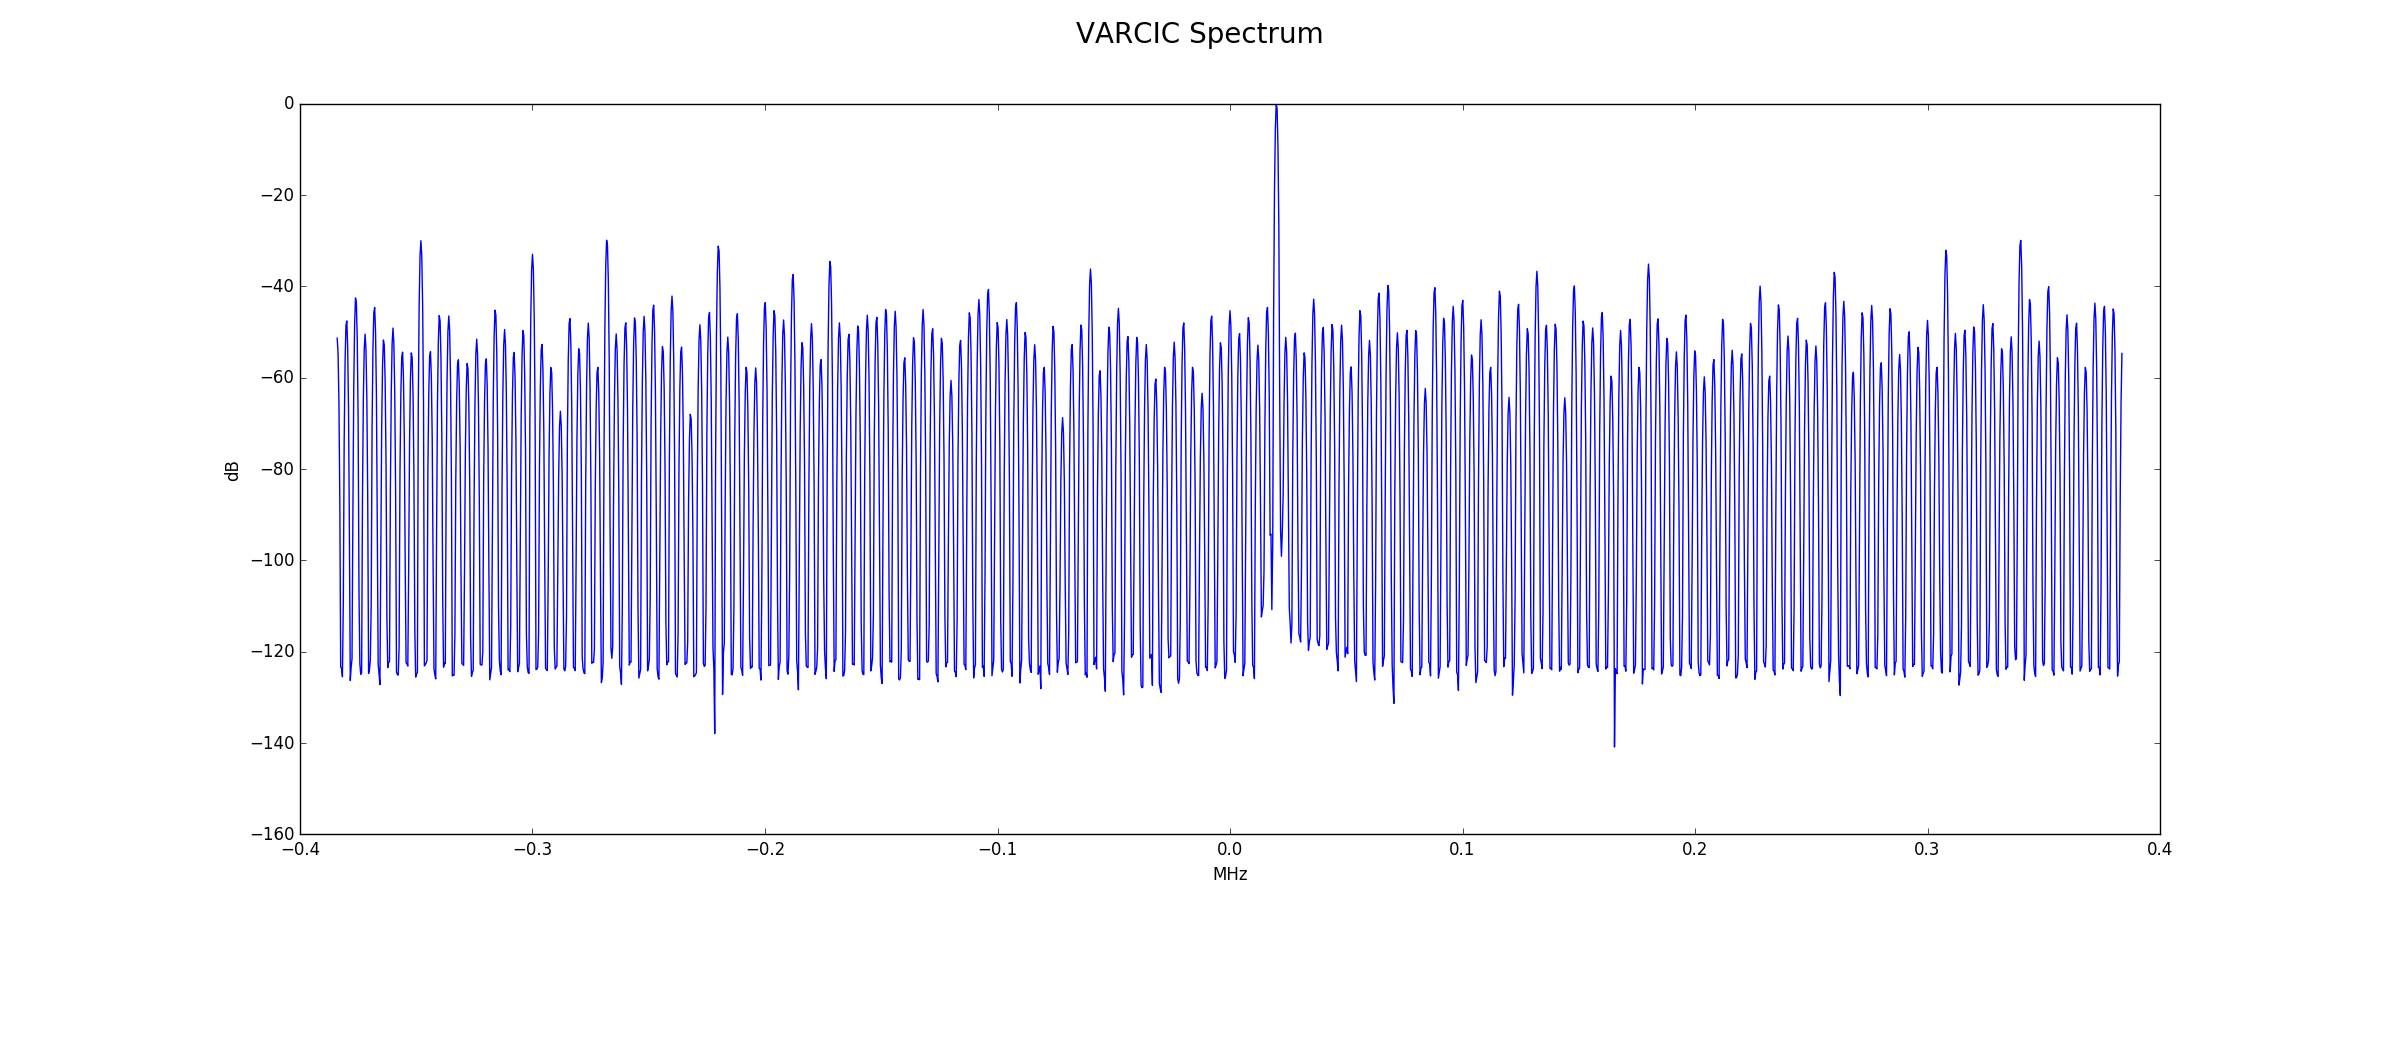
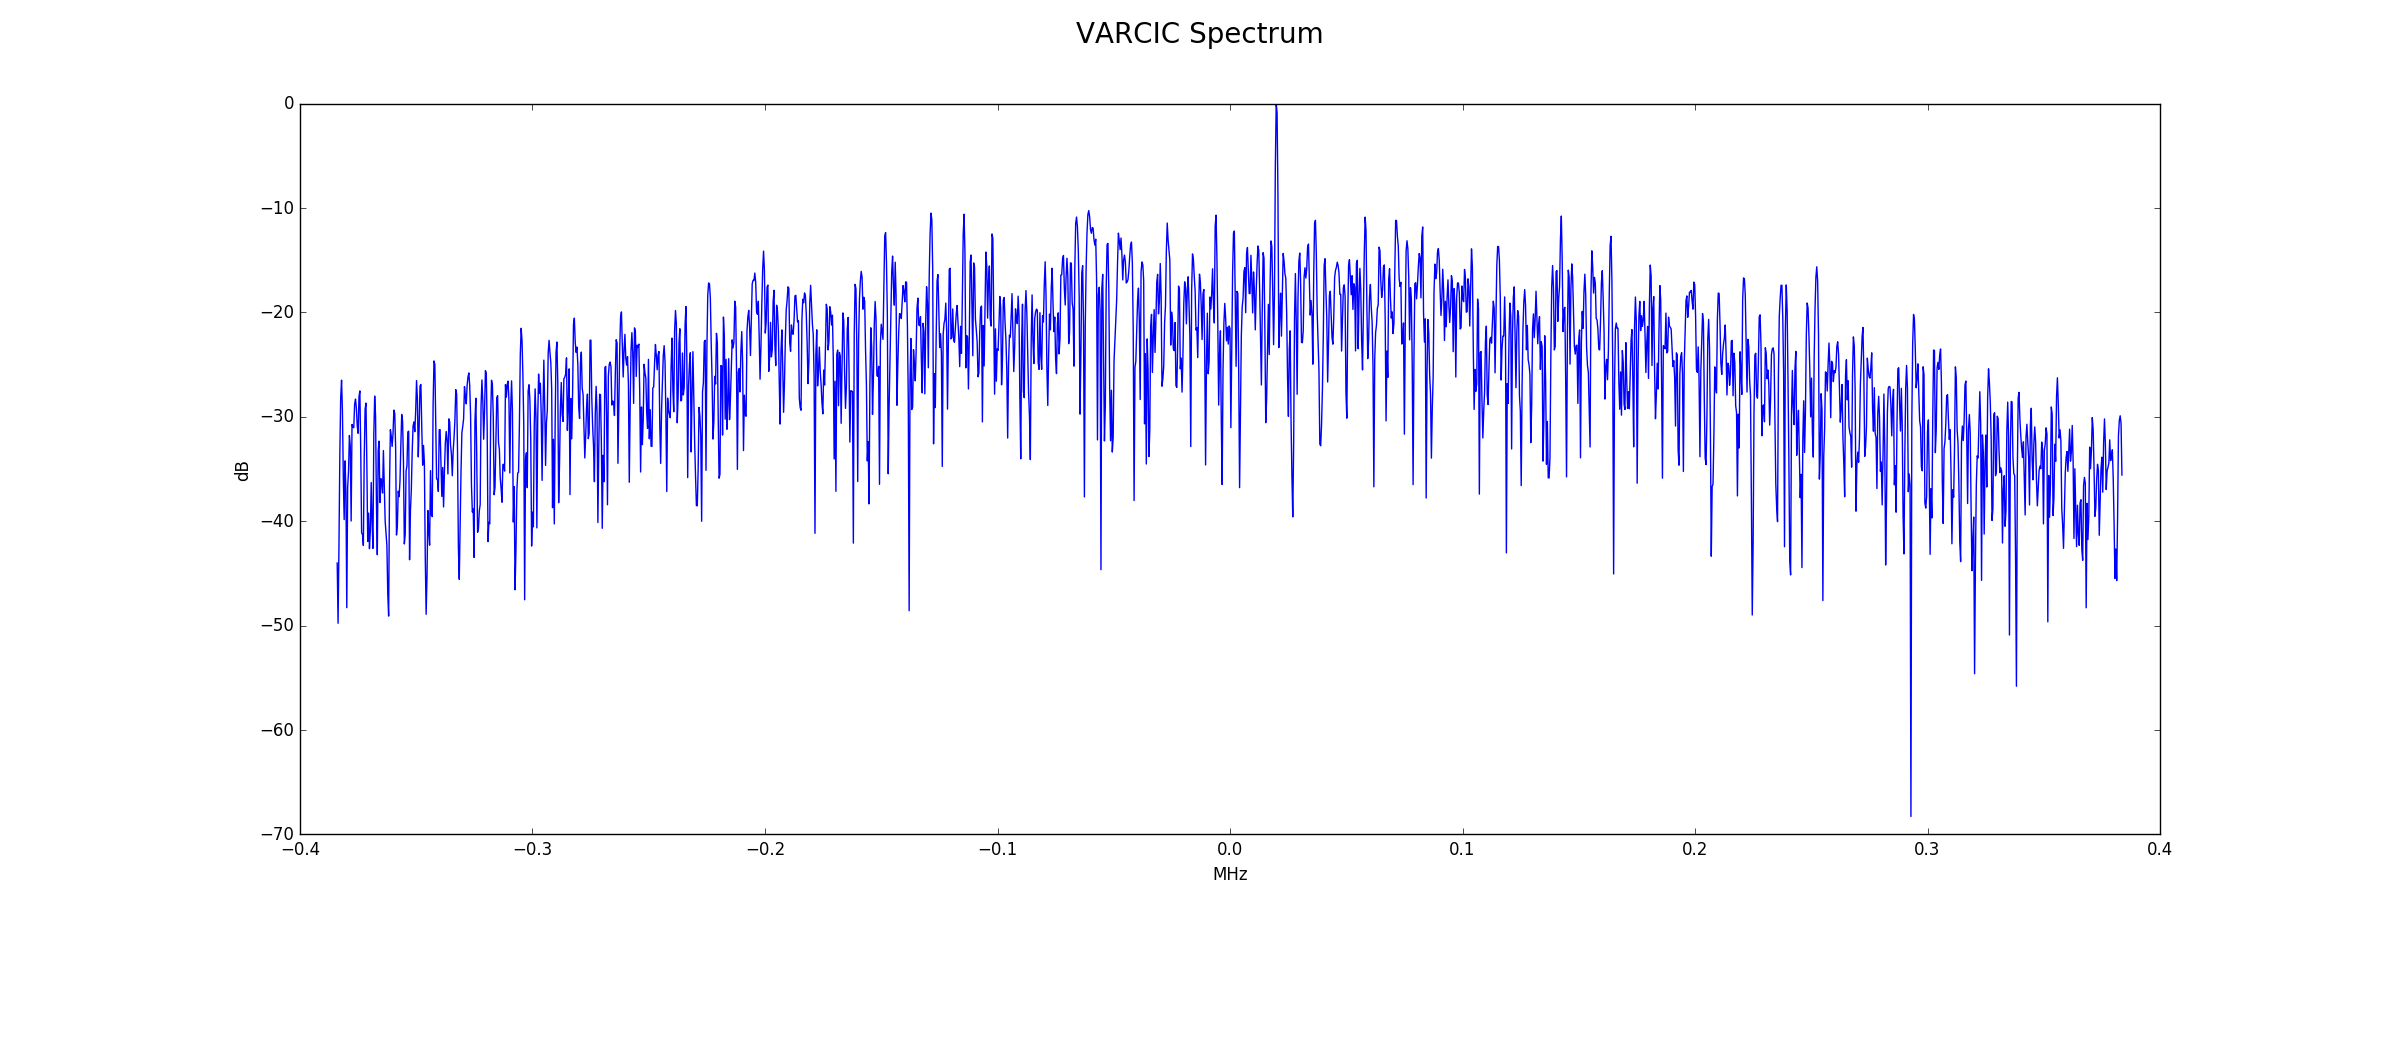
VARCIC Output
Below is the frequency spectrum at the variable CIC output. Note that this is still before the final FIR filter which will further decimate by 8, hence the 768 kHz (768/8 == 96) displayed in the plot. Processing gain is 33.1 dB for the FFT and 19.8 dB for the filters. The expected noise floor is then 74+33.1+19.8=126.9 dB and is in fair agreement with the plot.
Minimum Strength Signal
The 5.02 MHz synthetic signal was scaled in amplitude so that only the least significant bit ever changes. Also, there is no nice multiple of 5.02 MHz that will equal the sampling frequency of 73.728 MHz. This can't be represented by a short sequence of bit changes and forces a longer and more complex sequence. The tests check to see if this minimum strength signal is still detectable.
14-Bit CIC to VARCIC Path
Cordic Output
Below is the frequency spectrum at the Cordic output. The largest amplitude signal is the Cordic tuning frequency of -5.0 MHz. The images at 0.02 MHz and -10.02 MHz are still visible.
CIC Output
Below is the frequency spectrum at the CIC output. The signal of interest is still clearly visible.

VARCIC Output
Below is the frequency spectrum at the VARCIC output. The signal of interest is still clearly visible.
16-Bit CIC to VARCIC Path
Reports indicate that increasing the width from 14 to 16 bits between the CIC and VARCIC improves minimum strength signal detection.
Cordic Output
There is no change in the Cordic output compared to the 14-bit case as no data widths have changed up to this point in the processing chain.
CIC Output
Below is the frequency spectrum at the CIC output. The signal of interest is still clearly visible. If you imagine a horizontal line at -40 dB, you can see that there are fewer noise spikes traversed in this 16-bit configuration when compared to the earlier 14-bit configuration.
VARCIC Output
Below is the frequency spectrum at the VARCIC output. The signal of interest is still clearly visible. Again, an imagined horizontal line at -50 dB indicates that there is probably less noise in the 16-bit configuration.
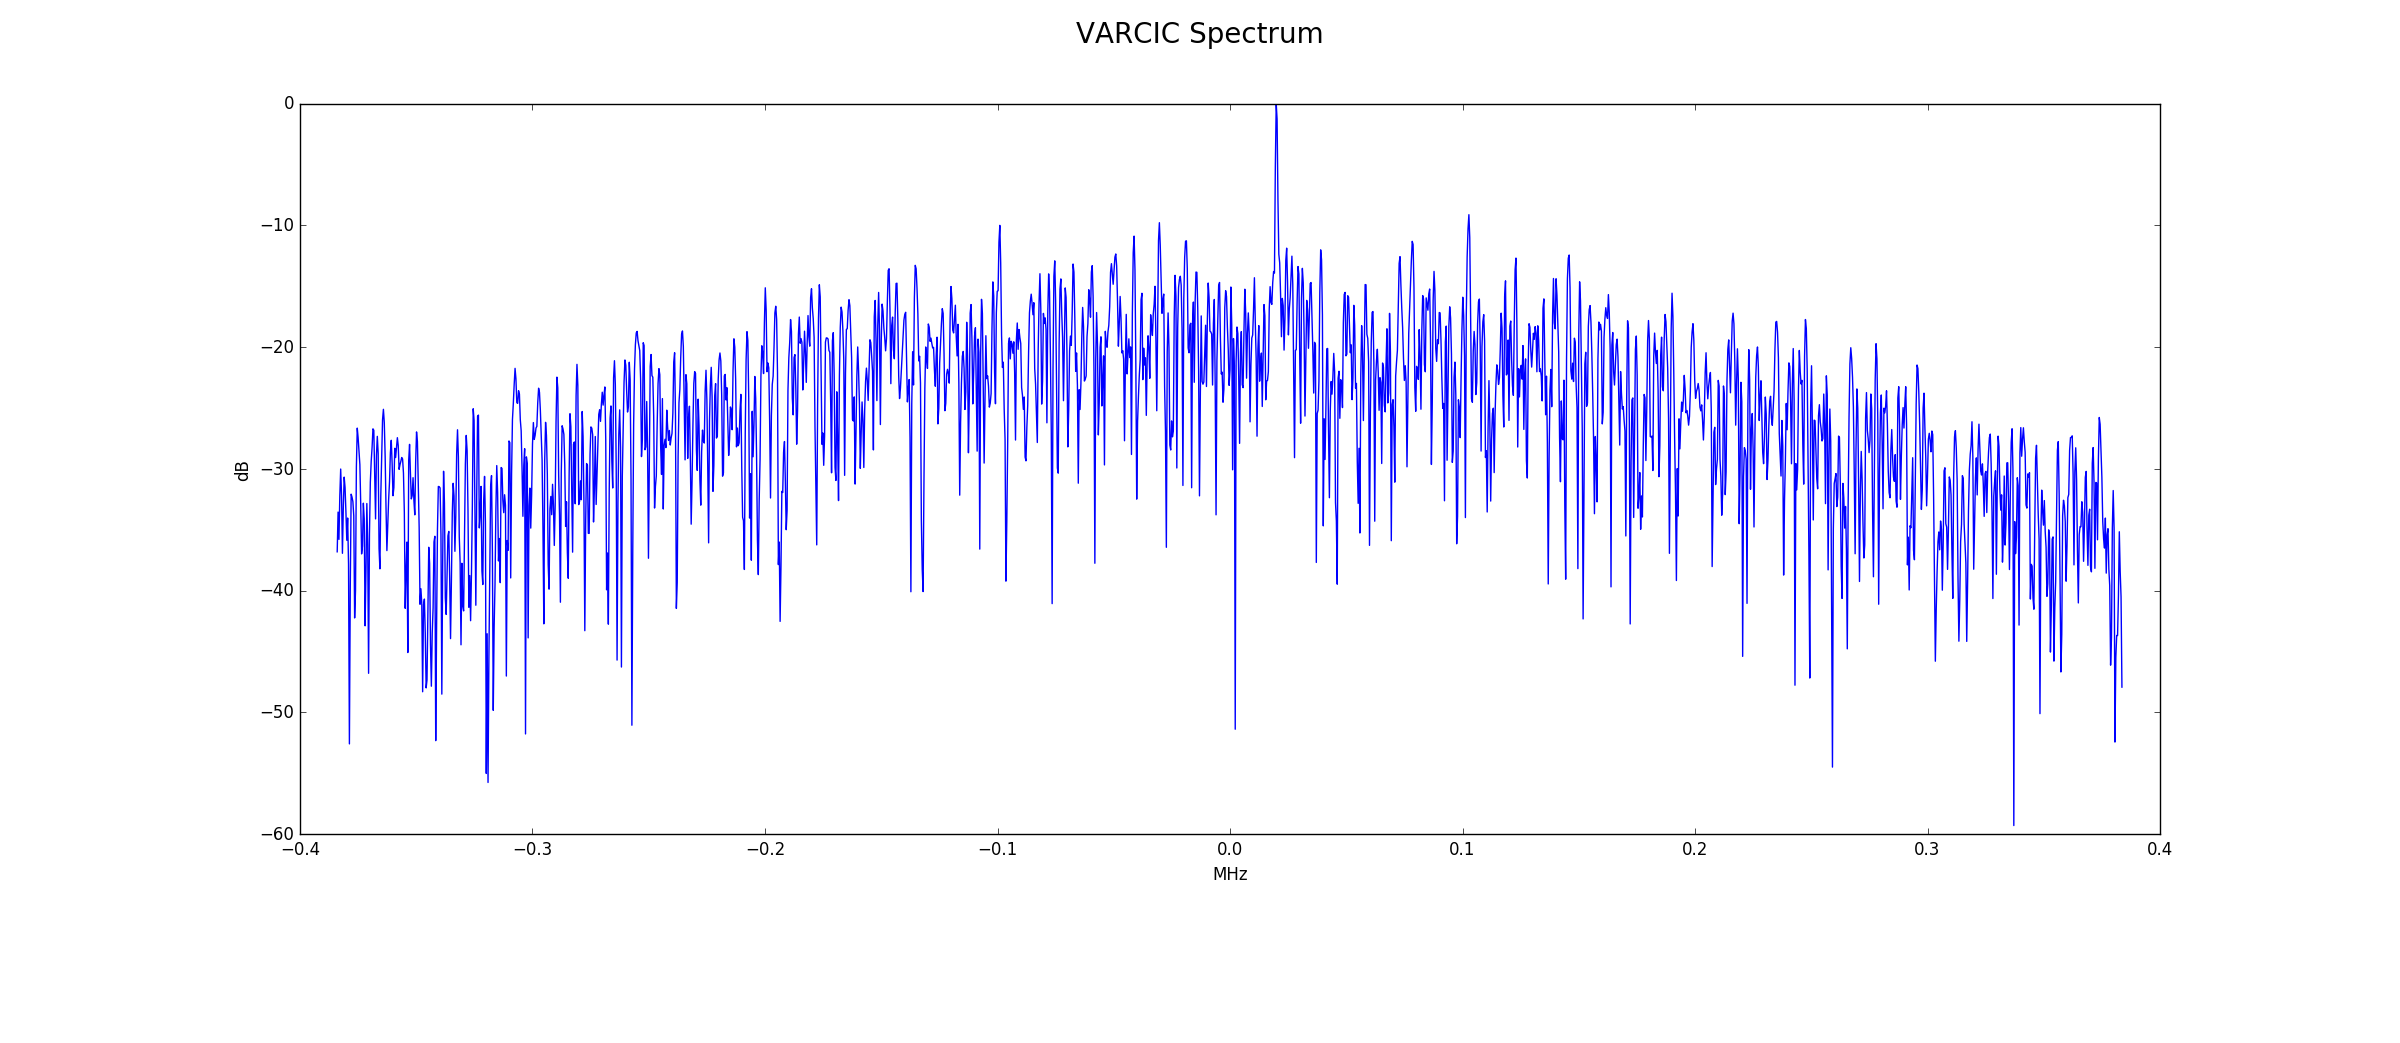
Minimum Strength Signal with Added Noise and Dither
To see the effects of noise and dither, Gaussian noise was added to the synthetic signal as well as a relatively strong out of band signal at 7.123456 MHz.
14-Bit CIC to VARCIC Path
Cordic Output
Below is the frequency spectrum at the Cordic output. The dither signal and its image are clearly visible, but it hard to see the signal of interest at 20 kHz. The additional processing gains of the later filters will "dig" the signal out of the noise so that it is visible. There appears to be a spur at the proper frequency, but if examine closely this is too high in frequency. When these plots are created with matplotlib and before they are converted to a static .png image, they can be zoomed. There is no significant signal at 20 kHz.
CIC Output
Below is the frequency spectrum at the CIC output. The dither signal and a spur from it are clearly visible. The signal of interest at 20 kHz is starting to stand out. The added noise is outlining the expected response of a CIC filter.
VARCIC Output
Below is the frequency spectrum at the VARCIC output. The signal of interest is now obvious. The response of the two CIC filters is clearly visible. Since this signal will be fed to a sharper FIR filter which decimates by 8, only the fairly flat region from -48 kHz to +48 kHz will eventually matter. One idea is to just eliminate the FIR filter and always tune the LO close to the signal of interest so that the signal of interest is in the flat part of the CIC response. The additional bandwidth which rolls off is kept and used for visualization. Pictures of SDR# software appear to show this in action.
16-Bit CIC to VARCIC Path
CIC Output
Below is the frequency spectrum at the CIC output. It is harder to tell if there is any improvement over the 14-bit configuration. Averages of the noise in frequency ranges with no single are within 1 dB of the 14-bit configuration.
VARCIC Output
Below is the frequency spectrum at the VARCIC output. Again, signal averages for equivalent frequency ranges with no true signal are roughly the same as the 14-bit configuration.
Rerun the Simulations
All code required to repeat the results presented is available in the Hermes-Lite2 github repository. A good knowledge of Python, DSP and Verilog RTL is required. Also, the packages mentioned earlier must all be installed. To get started, try,
cd Hermes-Lite2/gateware/sim
test_rx2IQ.py data/sim16_1p0.pkl
to create frequency-domain plots for a previous simulation run.
To rerun the simulation,
test_rx2IQ.py test.pkl -sim
Many parameters for the simulation run must be set directly in the test_rxIQ.py script.