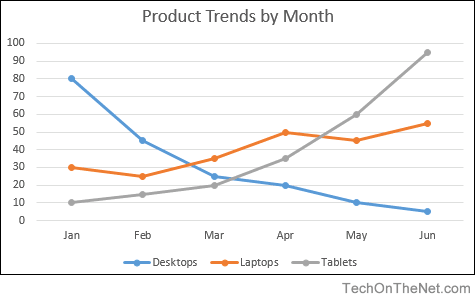
JavaScript Line Charts & Graphs - smallQuerty/canvas_charts GitHub Wiki
<!DOCTYPE html>
<html lang="en-US">
<body>
<div id="piechart"></div>
<script type="text/javascript" src="https://www.gstatic.com/charts/loader.js"></script>
<script type="text/javascript">
// Load google charts
google.charts.load('current', {'packages':['corechart']});
google.charts.setOnLoadCallback(drawChart);
// Draw the chart and set the chart values
function drawChart() {
var data = google.visualization.arrayToDataTable([
['Stores', 'sales per day'],
['store A', 15.1 %],
['store B', 15.4 %],
['store C', 21.9 %],
['store D', 13.3 %],
['store E', 11.8 %],
['store F', 22.6 %],
]);
// Optional; add a title and set the width and height of the chart
var options = {'title':'Sales by store', 'width':550, 'height':400};
// Display the chart inside the <div> element with id="piechart"
var chart = new google.visualization.PieChart(document.getElementById('piechart'));
chart.draw(data, options);
}
</script>
</body>
</html>
    `content.lineTo(x,y);`
    `content.stroke();`
    `content.beginPath();`
    `content.arc(x,y,(4,0,2*Math.PI));` //circle
    `content.stroke();`
    `content.fillStyle="colour";`
    `content.fill();`
    `content.moveTo(x,y);`
After creating canvas, you can make chart from your data or from new data inserted with real-time input
Custom input for y in range 0 - 700
Fixed input for x = 100
for(let i=0;i<yourvector.length;i++)
{
if (i==0)
{
x=100;
}
    `content.lineTo(x,700-yourvector[i]);`
    `content.stroke();`
    `content.beginPath();`
    `content.arc(x,700-yourvector[i],4,0,2*Math.PI);`
    `content.stroke();`
    `content.fillStyle="black";`
    `content.fill();`
    `content.moveTo(x,700-yourvector[i]);`
x+=100;
}

