3.1.From Problem to Approach and From Requirements to Collection - sj50179/IBM-Data-Science-Professional-Certificate GitHub Wiki
Syllabus
Module 1: From Problem to Approach and from Requirements to Collection
- Business Understanding
- Analytic Approach
- Data Requirements
- Data Collection
- Lab: From Problem to Approach
- Lab: From Requirement to Collection
- Quiz: From Problem to Approach
- Quiz: From Requirement to Collection
Module 2: From Understanding to Preparation and from Modeling to Evaluation
- Data Understanding
- Data Preparation
- Modeling
- Evaluation
- Lab: From Understanding to Preparation
- Lab: From Modeling to Evaluation
- Quiz: From Understanding to Preparation
- Quiz: From Modeling to Evaluation
Module 3: From Deployment to Feedback
- Deployment
- Feedback
- Quiz: From Deployment to Feedback
- Peer-review Assignment
Welcome
Welcome to Data Science Methodology 101! This is the beginning of a story- one that you'll be telling others about for years to come. It won't be in the form you experience here, but rather through the stories you'll be sharing with others, as you explain how your understanding of a question resulted in an answer that changed the way something was done. Despite the recent increase in computing power and access to data over the last couple of decades, our ability to use the data within the decision making process is either lost or not maximized as all too often, we don't have a solid understanding of the questions being asked and how to apply the data correctly to the problem at hand. Here is a definition of the word methodology. It's important to consider it because all too often there is a temptation to bypass methodology and jump directly to solutions. Doing so, however, hinders our best intentions in trying to solve a problem. This course has one purpose, and that is to share a methodology that can be used within data science, to ensure that the data used in problem solving is relevant and properly manipulated to address the question at hand. The data science methodology discussed in this course has been outlined by John Rollins, a seasoned and senior data scientist currently practising at IBM. This course is built on his experience and expresses his position on the importance of following a methodology to be successful. In a nutshell, the Data Science Methodology aims to answer 10 basic questions in a prescribed sequence. As you can see from this slide, there are two questions designed to define the issue and thus determine the approach to be used; then there are four questions that will help you get organized around the data you will need, and finally there are four additional questions aimed at validating both the data and the approach that gets designed. Please take a moment now to familiarize yourself with the ten questions, as they will be vital to your success.

This course is comprised of several components: There are five modules, each going through two stages of the methodology, explaining the rationale as to why each stage is required. Within the same module, a case study is shared that supports what you have just learned. There's also a hands-on lab, which helps to apply the material and finally there are three review questions to test your understanding of the concepts. When you are ready, Take the final exam. The case study included in the course, highlights how the data science methodology can be applied in context. It revolves around the following scenario: There is a limited budget for providing healthcare in the system to properly address the patient condition prior to the initial patient discharge. The core question is: What is the best way to allocate these funds to maximize their use in providing quality care? As you'll see, if the new data science pilot program is successful, it will deliver better patient care by giving physicians new tools to incorporate timely, data-driven information into patient care decisions. The case study sections display these icons at the top right hand corner of your screen to help you differentiate theory from practice within each module.

A glossary of data science terms is also provided to assist with clarifying key terms used within the course. While participating in the course, if you come across challenges, or have questions, then please explore the discussion and wiki sessions.

So, now that you're all set, adjust your headphones and let's get started!
Data Science Methodologies
This course focuses on the Foundational Methodology for Data Science by John Rollins, which was introduced in the previous video. However, it is not the only methodology that you will encounter in data science. For example, in data mining, the Cross Industry Process for Data Mining (CRISP-DM) methodology is widely used.
What is CRISP-DM?
The CRISP-DM methodology is a process aimed at increasing the use of data mining over a wide variety of business applications and industries. The intent is to take case specific scenarios and general behaviors to make them domain neutral. CRISP-DM is comprised of six steps with an entity that has to implement in order to have a reasonable chance of success. The six steps are shown in the following diagram:
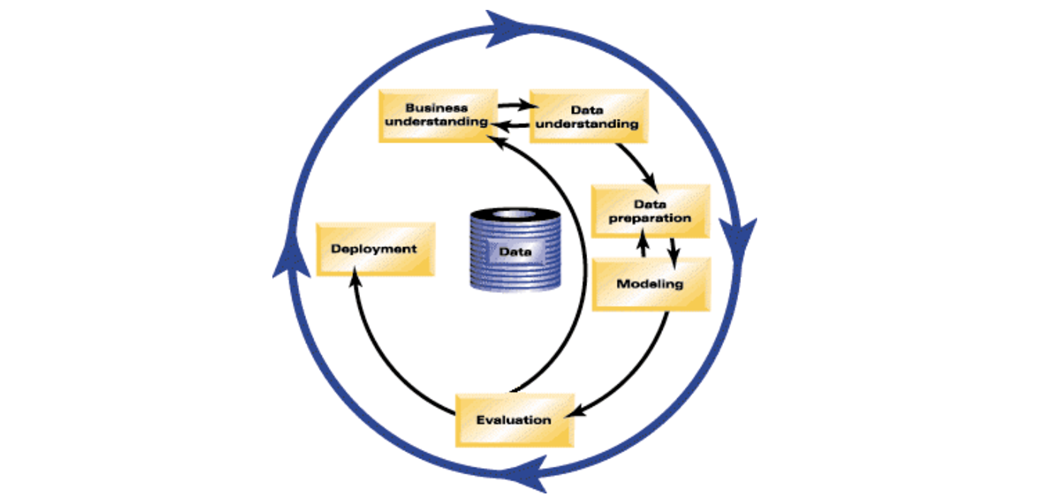 Fig.1 CRISP-DM model, [IBM Knowledge Center, CRISP-DM Help Overview]
- Business Understanding This stage is the most important because this is where the intention of the project is outlined. Foundational Methodology and CRISP-DM are aligned here. It requires communication and clarity. The difficulty here is that stakeholders have different objectives, biases, and modalities of relating information. They don’t all see the same things or in the same manner. Without clear, concise, and complete perspective of what the project goals are resources will be needlessly expended.
- Data Understanding Data understanding relies on business understanding. Data is collected at this stage of the process. The understanding of what the business wants and needs will determine what data is collected, from what sources, and by what methods. CRISP-DM combines the stages of Data Requirements, Data Collection, and Data Understanding from the Foundational Methodology outline.
- Data Preparation Once the data has been collected, it must be transformed into a useable subset unless it is determined that more data is needed. Once a dataset is chosen, it must then be checked for questionable, missing, or ambiguous cases. Data Preparation is common to CRISP-DM and Foundational Methodology.
- Modeling Once prepared for use, the data must be expressed through whatever appropriate models, give meaningful insights, and hopefully new knowledge. This is the purpose of data mining: to create knowledge information that has meaning and utility. The use of models reveals patterns and structures within the data that provide insight into the features of interest. Models are selected on a portion of the data and adjustments are made if necessary. Model selection is an art and science. Both Foundational Methodology and CRISP-DM are required for the subsequent stage.
- Evaluation The selected model must be tested. This is usually done by having a pre-selected test, set to run the trained model on. This will allow you to see the effectiveness of the model on a set it sees as new. Results from this are used to determine efficacy of the model and foreshadows its role in the next and final stage.
- Deployment In the deployment step, the model is used on new data outside of the scope of the dataset and by new stakeholders. The new interactions at this phase might reveal the new variables and needs for the dataset and model. These new challenges could initiate revision of either business needs and actions, or the model and data, or both.
CRISP-DM is a highly flexible and cyclical model. Flexibility is required at each step along with communication to keep the project on track. At any of the six stages, it may be necessary to revisit an earlier stage and make changes. The key point of this process is that it’s cyclical; therefore, even at the finish you are having another business understanding encounter to discuss the viability after deployment. The journey continues.
For more information on CRISP-DM, go to: IBM Knowledge Center – CRISP-DM Help Overview
From Problem to Approach
Business Understanding
Welcome to Data Science Methodology 101 From Problem to Approach Business Understanding! Has this ever happened to you? You've been called into a meeting by your boss, who makes you aware of an important task one with a very tight deadline that absolutely has to be met. You both go back and forth to ensure that all aspects of the task have been considered and the meeting ends with both of you confident that things are on track. Later that afternoon, however, after you've spent some time examining the various issues at play, you realize that you need to ask several additional questions in order to truly accomplish the task. Unfortunately, the boss won't be available again until tomorrow morning. Now, with the tight deadline still ringing in your ears, you start feeling a sense of uneasiness. So, what do you do? Do you risk moving forward or do you stop and seek clarification. Data science methodology begins with spending the time to seek clarification, to attain what can be referred to as a business understanding. Having this understanding is placed at the beginning of the methodology because getting clarity around the problem to be solved, allows you to determine which data will be used to answer the core question. Rollins suggests that having a clearly defined question is vital because it ultimately directs the analytic approach that will be needed to address the question. All too often, much effort is put into answering what people THINK is the question, and while the methods used to address that question might be sound, they don't help to solve the actual problem. Establishing a clearly defined question starts with understanding the GOAL of the person who is asking the question. For example, if a business owner asks: "How can we reduce the costs of performing an activity?" We need to understand, is the goal to improve the efficiency of the activity? Or is it to increase the businesses profitability? Once the goal is clarified, the next piece of the puzzle is to figure out the objectives that are in support of the goal. By breaking down the objectives, structured discussions can take place where priorities can be identified in a way that can lead to organizing and planning on how to tackle the problem. Depending on the problem, different stakeholders will need to be engaged in the discussion to help determine requirements and clarify questions. So now, let's look at the case study related to applying "Business Understanding" In the case study, the question being asked is: What is the best way to allocate the limited healthcare budget to maximize its use in providing quality care? This question is one that became a hot topic for an American healthcare insurance provider. As public funding for readmissions was decreasing, this insurance company was at risk of having to make up for the cost difference,which could potentially increase rates for its customers. Knowing that raising insurance rates was not going to be a popular move, the insurance company sat down with the health care authorities in its region and brought in IBM data scientists to see how data science could be applied to the question at hand. Before even starting to collect data, the goals and objectives needed to be defined. After spending time to determine the goals and objectives, the team prioritized "patient readmissions" as an effective area for review. With the goals and objectives in mind, it was found that approximately 30% of individuals who finish rehab treatment would be readmitted to a rehab center within one year; and that 50% would be readmitted within five years. After reviewing some records, it was discovered that the patients with congestive heart failure were at the top of the readmission list. It was further determined that a decision-tree model could be applied to review this scenario, to determine why this was occurring. To gain the business understanding that would guide the analytics team in formulating and performing their first project, the IBM Data scientists, proposed and delivered an on-site workshop to kick things off. The key business sponsors involvement throughout the project was critical, in that the sponsor: Set overall direction Remained engaged and provided guidance. Ensured necessary support, where needed. Finally, four business requirements were identified for whatever model would be built. Namely: Predicting readmission outcomes for those patients with Congestive Heart Failure Predicting readmission risk. Understanding the combination of events that led to the predicted outcome Applying an easy-to-understand process to new patients, regarding their readmission risk. This ends the Business Understanding section of this course.
Analytic Approach
Selecting the right analytic approach depends on the question being asked. The approach involves seeking clarification from the person who is asking the question, so as to be able to pick the most appropriate path or approach. In this video we'll see how the second stage of the data science methodology is applied. Once the problem to be addressed is defined, the appropriate analytic approach for the problem is selected in the context of the business requirements. This is the second stage of the data science methodology. Once a strong understanding of the question is established, the analytic approach can be selected. This means identifying what type of patterns will be needed to address the question most effectively. If the question is to determine probabilities of an action, then a predictive model might be used. If the question is to show relationships, a descriptive approach maybe be required. This would be one that would look at clusters of similar activities based on events and preferences. Statistical analysis applies to problems that require counts. For example if the question requires a yes/ no answer, then a classification approach to predicting a response would be suitable. Machine Learning is a field of study that gives computers the ability to learn without being explicitly programmed. Machine Learning can be used to identify relationships and trends in data that might otherwise not be accessible or identified. In the case where the question is to learn about human behaviour, then an appropriate response would be to use Clustering Association approaches. So now, let's look at the case study related to applying Analytic Approach. For the case study, a decision tree classification model was used to identify the combination of conditions leading to each patient's outcome. In this approach, examining the variables in each of the nodes along each path to a leaf, led to a respective threshold value. This means the decision tree classifier provides both the predicted outcome, as well as the likelihood of that outcome, based on the proportion at the dominant outcome, yes or no, in each group. From this information, the analysts can obtain the readmission risk, or the likelihood of a yes for each patient. If the dominant outcome is yes, then the risk is simply the proportion of yes patients in the leaf. If it is no, then the risk is 1 minus the proportion of no patients in the leaf. A decision tree classification model is easy for non-data scientists to understand and apply, to score new patients for their risk of readmission. Clinicians can readily see what conditions are causing a patient to be scored as high-risk and multiple models can be built and applied at various points during hospital stay. This gives a moving picture of the patient's risk and how it is evolving with the various treatments being applied. For these reasons, the decision tree classification approach was chosen for building the Congestive Heart Failure readmission model. This ends the Analytic Approach section for this course.
Lesson Summary
In this lesson, you have learned:
- The need to understand and prioritize the business goal.
- The way stakeholder support influences a project.
- The importance of selecting the right model.
- When to use a predictive, descriptive, or classification model.
From Requirements to Collection
Data Requirements
If your goal is to make a spaghetti dinner but you don't have the right ingredients to make the dish, then your success will be compromised. Think of this section of the data science methodology as cooking with data. Each step is critical in making the meal. So, if the problem that needs to be resolved is the recipe, so to speak, and data is an ingredient, then the data scientist needs to identify: which ingredients are required, how to source or to collect them, how to understand or work with them, and how to prepare the data to meet the desired outcome. Building on the understanding of the problem at hand, and then using the analytical approach selected, the Data Scientist is ready to get started.

Now let's look at some examples of the data requirements within the data science methodology. Prior to undertaking the data collection and data preparation stages of the methodology, it's vital to define the data requirements for decision-tree classification. This includes identifying the necessary data content, formats and sources for initial data collection.
So now, let's look at the case study related to applying "Data Requirements".

In the case study, the first task was to define the data requirements for the decision tree classification approach that was selected. This included selecting a suitable patient cohort from the health insurance providers member base. In order to compile the complete clinical histories, three criteria were identified for inclusion in the cohort. First, a patient needed to be admitted as in-patient within the provider service area, so they'd have access to the necessary information. Second, they focused on patients with a primary diagnosis of congestive heart failure during one full year. Third, a patient must have had continuous enrollment for at least six months, prior to the primary admission for congestive heart failure, so that complete medical history could be compiled. Congestive heart failure patients who also had been diagnosed as having other significant medical conditions, were excluded from the cohort because those conditions would cause higher-than-average re-admission rates and, thus, could skew the results.

Then the content, format, and representations of the data needed for decision tree classification were defined. This modeling technique requires one record per patient, with columns representing the variables in the model. To model the readmission outcome, there needed to be data covering all aspects of the patient's clinical history. This content would include admissions, primary, secondary, and tertiary diagnoses, procedures, prescriptions, and other services provided either during hospitalization or throughout patient/doctor visits. Thus, a particular patient could have thousands of records, representing all their related attributes. To get to the one record per patient format, the data scientists rolled up the transactional records to the patient level, creating a number of new variables to represent that information. This was a job for the data preparation stage, so thinking ahead and anticipating subsequent stages is important. This ends the Data Requirements section for this course.
Data Collection
Welcome to Data Science Methodology 101 From Requirements to Collection Data Collection! After the initial data collection is performed, an assessment by the data scientist takes place to determine whether or not they have what they need. As is the case when shopping for ingredients to make a meal, some ingredients might be out of season and more difficult to obtain or cost more than initially thought. In this phase the data requirements are revised and decisions are made as to whether or not the collection requires more or less data. Once the data ingredients are collected, then in the data collection stage, the data scientist will have a good understanding of what they will be working with. Techniques such as descriptive statistics and visualization can be applied to the data set, to assess the content, quality, and initial insights about the data. Gaps in data will be identified and plans to either fill or make substitutions will have to be made. In essence, the ingredients are now sitting on the cutting board.

Now let's look at some examples of the data collection stage within the data science methodology. This stage is undertaken as a follow-up to the data requirements stage.

So now, let's look at the case study related to applying "Data Collection". Collecting data requires that you know the source or, know where to find the data elements that are needed. In the context of our case study, these can include: demographic, clinical and coverage information of patients, provider information, claims records, as well as pharmaceutical and other information related to all the diagnoses of the congestive heart failure patients.

For this case study, certain drug information was also needed, but that data source was not yet integrated with the rest of the data sources. This leads to an important point: It is alright to defer decisions about unavailable data, and attempt to acquire it at a later stage. For example, this can even be done after getting some intermediate results from the predictive modeling. If those results suggest that the drug information might be important in obtaining a good model, then the time to try to get it would be invested. As it turned out though, they were able to build a reasonably good model without this drug information.

DBAs and programmers often work together to extract data from various sources, and then merge it. This allows for removing redundant data, making it available for the next stage of the methodology, which is data understanding. At this stage, if necessary, data scientists and analytics team members can discuss various ways to better manage their data, including automating certain processes in the database, so that data collection is easier and faster.
Lesson Summary
In this lesson, you have learned:
- The significance of defining the data requirements for your model.
- Why the content, format, and representation of your data matter.
- The importance of identifying the correct sources of data for your project.
- How to handle unavailable and redundant data.
- To anticipate the needs of future stages in the process.