3.1.2.Lab : From Requirements to Collection - sj50179/IBM-Data-Science-Professional-Certificate GitHub Wiki
From Requirements to Collection
Estimated time needed: 15 minutes
Objectives
After completing this lab you will be able to:
- Understand Data Requirements
- Explore the stages in Data Collection
Table of Contents
-
Data Requirements
-
Data Collection
Data Requirements
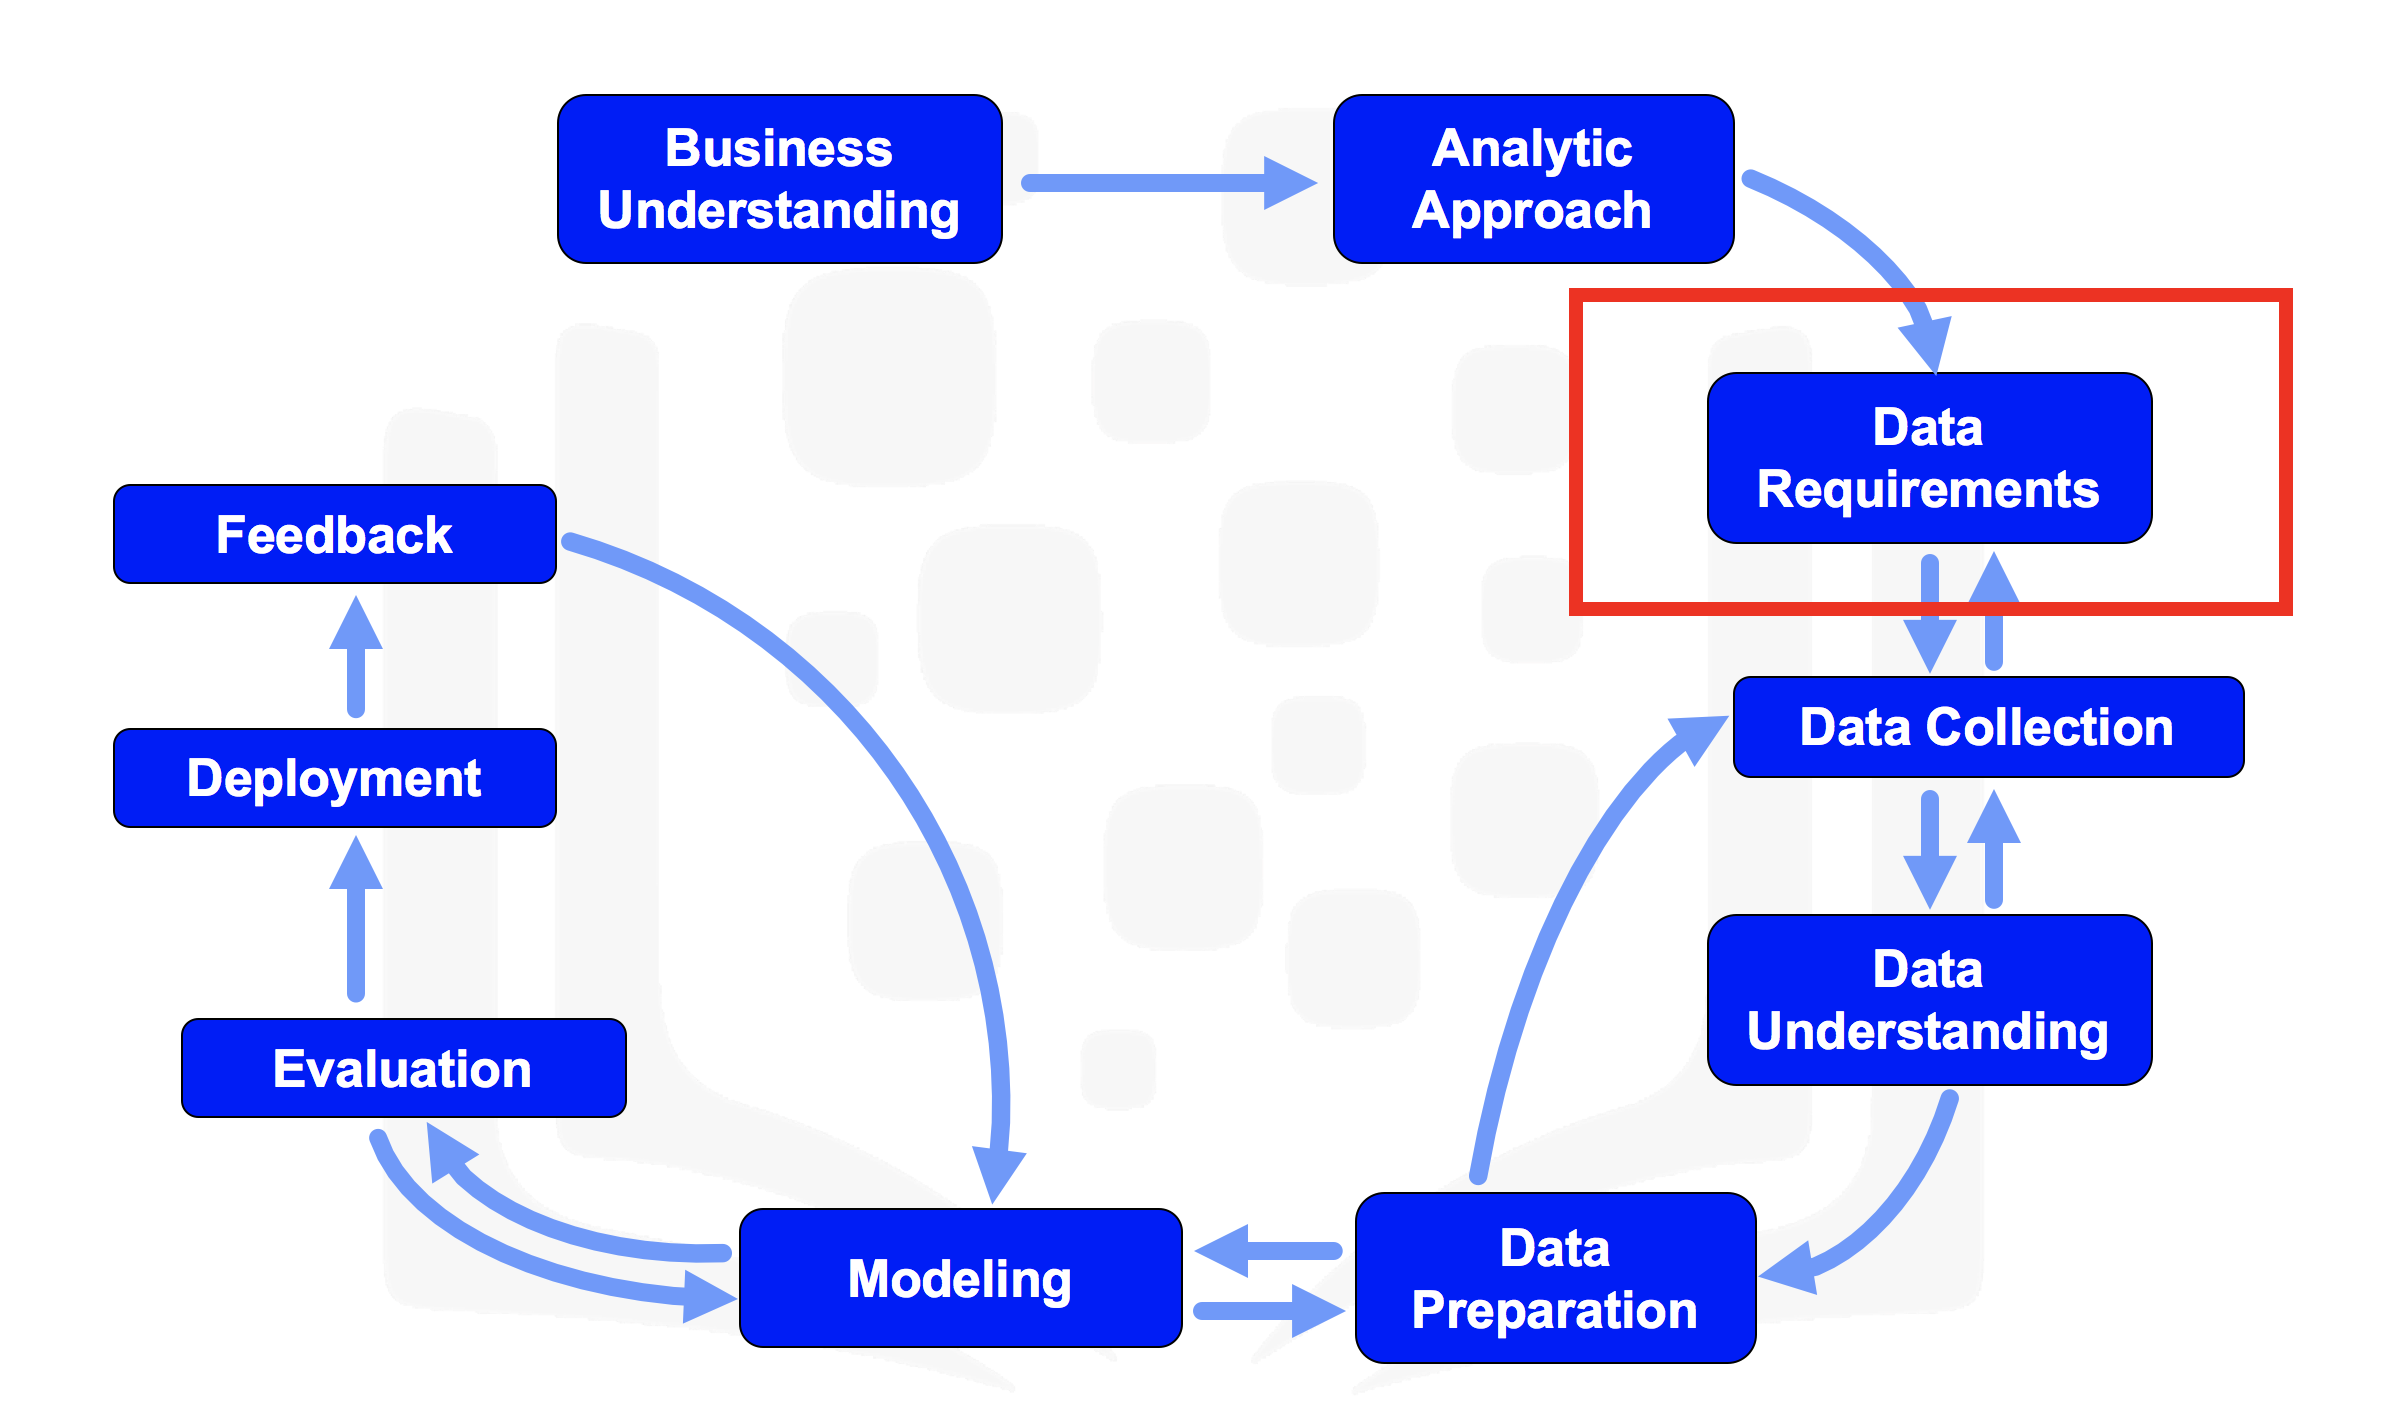
In the videos, we learned that the chosen analytic approach determines the data requirements. Specifically, the analytic methods to be used require certain data content, formats and representations, guided by domain knowledge.
In the From Problem to Approach Lab, we determined that automating the process of determining the cuisine of a given recipe or dish is potentially possible using the ingredients of the recipe or the dish. In order to build a model, we need extensive data of different cuisines and recipes.
Identifying the required data fulfills the data requirements stage of the data science methodology.
Data Collection
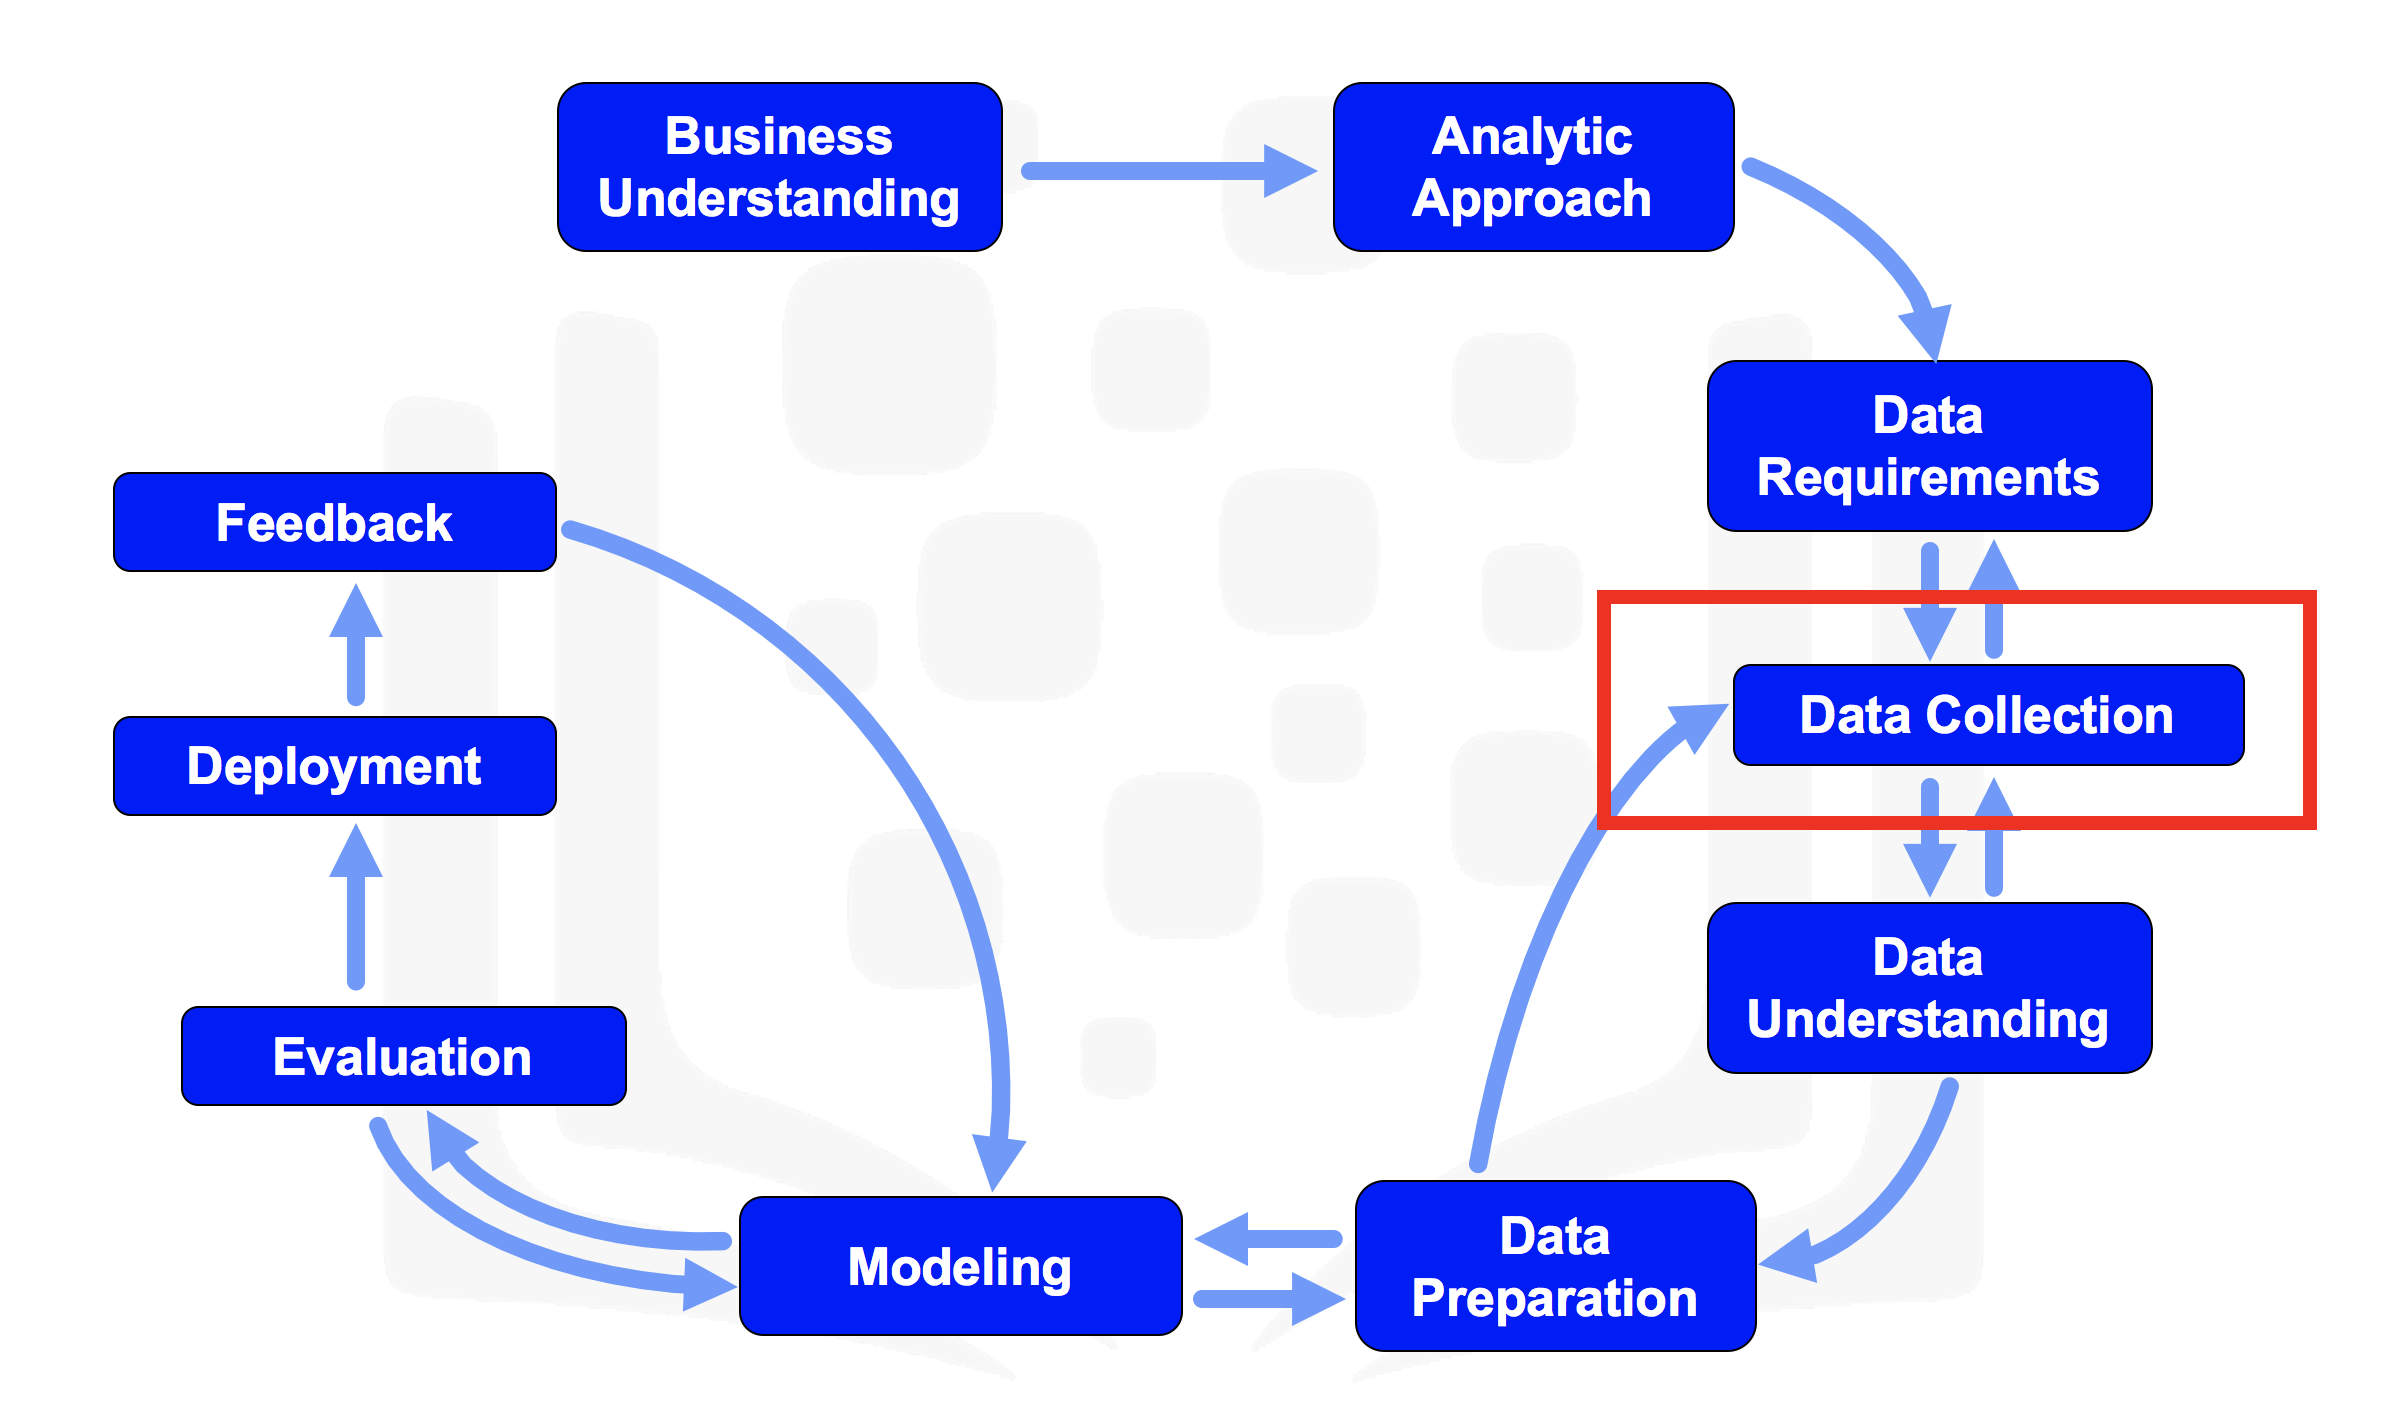
In the initial data collection stage, data scientists identify and gather the available data resources. These can be in the form of structured, unstructured, and even semi-structured data relevant to the problem domain.
Web Scraping of Online Food Recipes
A researcher named Yong-Yeol Ahn scraped tens of thousands of food recipes (cuisines and ingredients) from three different websites, namely:
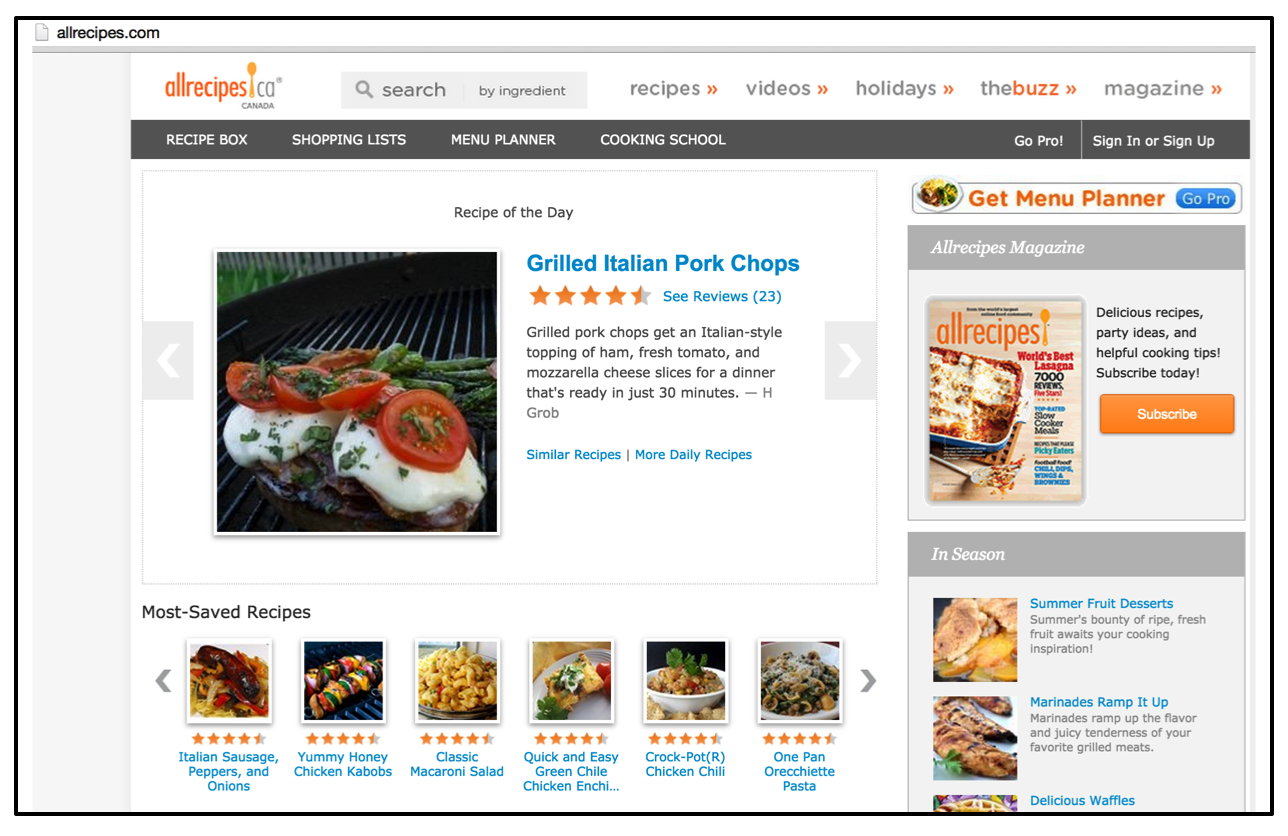
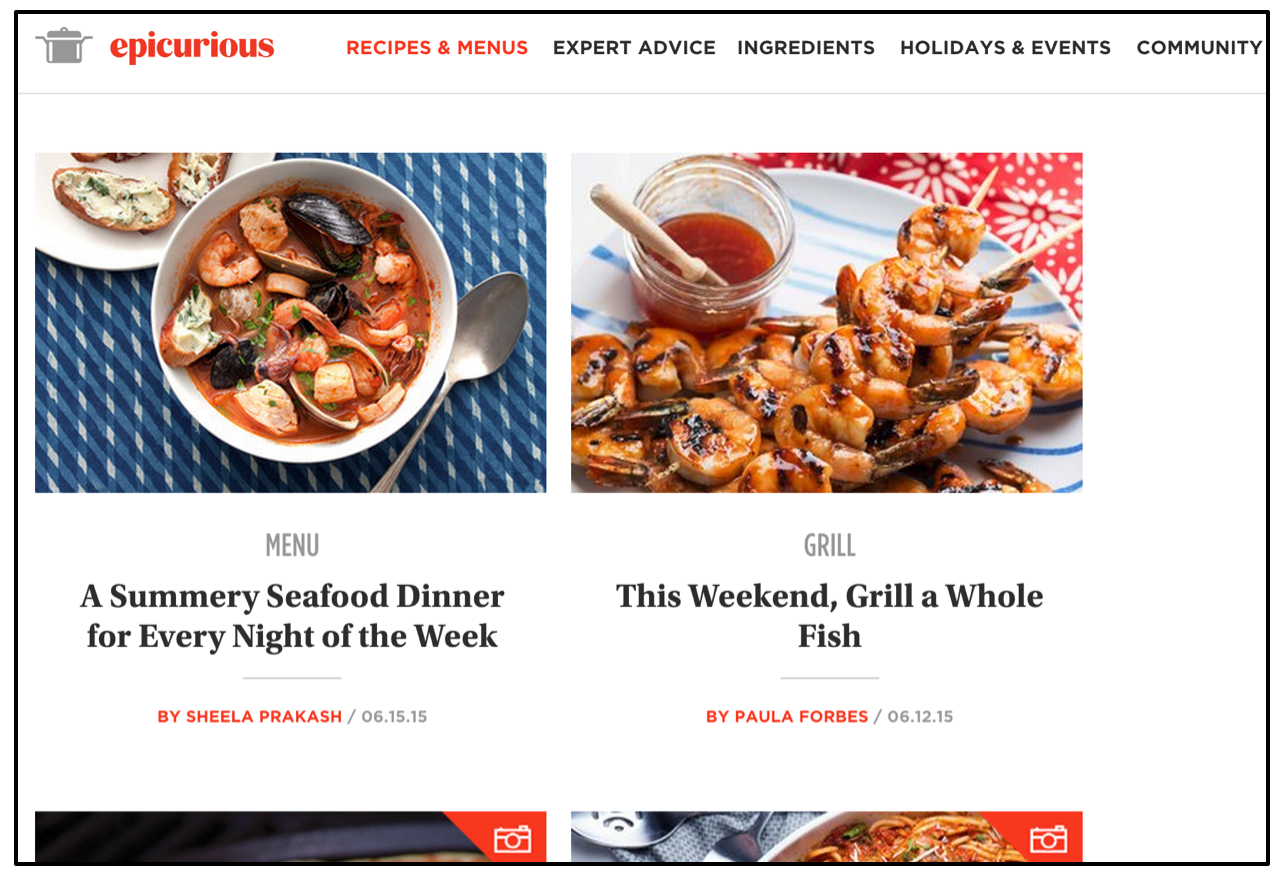
For more information on Yong-Yeol Ahn and his research, you can read his paper on Flavor Network and the Principles of Food Pairing.
Luckily, we will not need to carry out any data collection as the data that we need to meet the goal defined in the business understanding stage is readily available.
We have already acquired the data and placed it on an IBM server. Let's download the data and take a look at it.
**Did you know? IBM Watson Studio lets you build and deploy an AI solution, using the best of open source and IBM software and giving your team a single environment to work in. Learn more here.
Important note: Please note that you are not expected to know how to program in python. The following code is meant to illustrate the stage of data collection, so it is totally fine if you do not understand the individual lines of code. There will be a full course in this certificate on programming in python, Python for Data Science, which will teach you how to program in Python if you decide to complete this certificate.
Using this notebook:
To run any of the following cells of code, you can type Shift + Enter to excute the code in a cell.
Get the version of Python installed.
[1]:
# check Python version
!python -V
Python 3.6.13
Read the data from the IBM server into a pandas dataframe.
[2]:
import pandas as pd # download library to read data into dataframe
pd.set_option('display.max_columns', None)

recipes = pd.read_csv("https://cf-courses-data.s3.us.cloud-object-storage.appdomain.cloud/IBMDeveloperSkillsNetwork-DS0103EN-SkillsNetwork/labs/Module%202/recipes.csv")

print("Data read into dataframe!") # takes about 30 seconds
Data read into dataframe!
Show the first few rows.
[3]:
recipes.head()
Get the dimensions of the dataframe.
[4]:
recipes.shape
(57691, 384)
So our dataset consists of 57,691 recipes. Each row represents a recipe, and for each recipe, the corresponding cuisine is documented as well as whether 384 ingredients exist in the recipe or not beginning with almond and ending with zucchini.
Now that the data collection stage is complete, data scientists typically use descriptive statistics and visualization techniques to better understand the data and get acquainted with it. Data scientists, essentially, explore the data to:
- understand its content,
- assess its quality,
- discover any interesting preliminary insights, and,
- determine whether additional data is necessary to fill any gaps in the data.
Thank you for completing this lab!
This notebook is part of a course called The Data Science Method. If you accessed this notebook outside the course, you can take this course, online by clicking here.