sheetDashboard - simonschaluppe/peexcel GitHub Wiki
Im "Dashboard" werden alle Ergebnisse grafisch in Form von Diagrammen dargestellt.

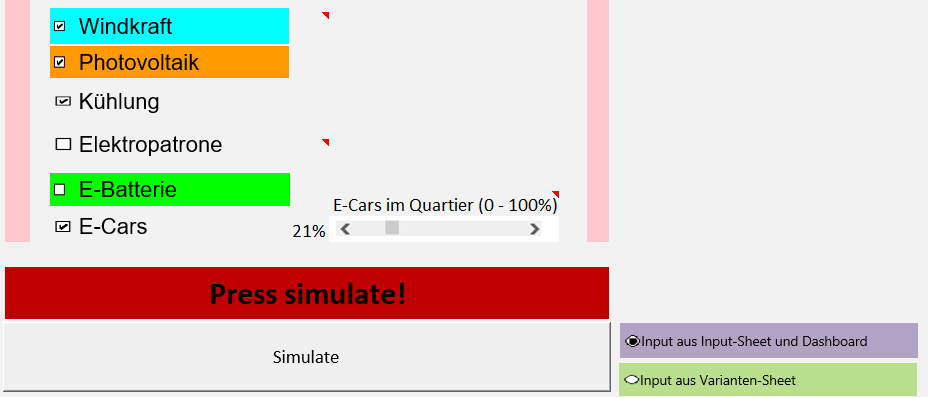
Zusätzlich können einzelne Varianten via Schaltfläche an der Seite umgeschalten werden. Hierbei kann beispielsweise über die Schaltflächen der PV-Strom zu- oder abgeschalten werden oder die thermische Gebäudehülle abgeändert werden.

Beachtet werden muss jedoch, dass für die Umschaltung der Switches das Feld "Input aus Input-Sheet und Dashboard" aktiviert werden muss (ist auch standardmäßig aktiv).
Ist dieses Feld nicht aktiv bzw. auf dem Feld "Input aus Varianten-Sheet" sind die Switches nicht aktiv und in den Diagrammen werden die Ergebnisse der Variante aus dem Varianten-Sheet dargestellt. Die Switches sind in diesem Fall nicht aktiv, da diese in der Variante schon abgespeichert wurden.
Zuletzt kann über die Eingabe des Monates in Zelle W57 die Lastkurve inkl. Deckung im gewählten Monat dargestellt werden.

In the "Dashboard" all results are displayed as diagrams.
In addition, individual variants can be switched via a button on the side. For example, the PV power can be switched on or off or the thermal building envelope can be changed via the buttons.
Please note, however, that the "Input from input sheet and dashboard" field must be activated for accepting the switches (this is also active by default).
If this field is not active or on the field "Input from variant sheet" the switches are not accepted and only the inputs from the variant sheet are considered.
Finally, the load curve in the selected month can be displayed by entering the month in cell W57.