Leaflet Quickstart - sentinelmap/sentinelmap-services GitHub Wiki
In this tutorial we cover the basics of setting up a web map based on the basemap by SentinelMap.eu. We will use HTML and leaflet.
Leflet is a JavaScript library that visualizes the tiles provided by the SentinelMap tile server. How does it work? The tiles themselves are 256px by 256px images in a .jpg format. Leaflet takes in the coordinates of the point you want to visualize (the map's center), and the zoom-level required, finds the corresponding images in the tile server and puts them on the page in a seamless way. After displaying the map, leaflet allows you also to navigate it, retrieving the images at a different zoom, or a different position (panning)... well, the whole process is a tad more complicated than this, what with filling the view area, downloading tiles simultaneously to speed up the process, etc., etc....
Without further ado, let's dive in our first page!
We start by including the leaflet.js and leaflet.css from unpkg:
<!doctype html>
<html lang="en">
<head>
    <meta charset="UTF-8"/>
    <title>SentinelMap Quick Start</title>

    <link rel="stylesheet" href="https://unpkg.com/[email protected]/dist/leaflet.css"
        integrity="sha512-07I2e+7D8p6he1SIM+1twR5TIrhUQn9+I6yjqD53JQjFiMf8EtC93ty0/5vJTZGF8aAocvHYNEDJajGdNx1IsQ=="
        crossorigin=""/>

    <script src="https://unpkg.com/[email protected]/dist/leaflet.js"
        integrity="sha512-A7vV8IFfih/D732iSSKi20u/ooOfj/AGehOKq0f4vLT1Zr2Y+RX7C+w8A1gaSasGtRUZpF/NZgzSAu4/Gc41Lg=="
        crossorigin=""></script>
We also set a style for our div, giving it 60% of the page width, and exactly 400px of height.
    <style>
    #map {
        width: 60%;
        height: 400px;
    }
    </style>

</head>
Next, we need to set on the page a div that will contain our map (we center it):
<body>
<h1>Our first map</h1>

<center><div id="map"></div></center>
<script>
// Leaflet code goes here.
</script>

</body>
</html>
With just this one <div> we set the stage for leaflet to visualize our map.
For leaflet to operate its magic, we need to define the JavaScript which will take care of visualizing the map. We do so, inside the <script> tag:
      var Url = 'https://tile.sentinelmap.eu/2016/summer/rgb/{z}/{x}/{y}.jpg?key=<my-sentinelmap-key>';
	  var Attr = 'Modified <a href="https://scihub.copernicus.eu/">Copernicus</a>' +
	  ' Sentinel data 2016 by ' +
	  '<a href="https://www.sentinelmap.eu">SentinelMap</a>' ;
	  var Layer = L.tileLayer(Url, {attribution: Attr});
	  var map = L.map('map', {
	  center: [48.92, 11.25],
	  zoom: 6,
	  maxZoom: 14,
	  minZoom: 5,
	  layers: [Layer],
	  });
If it's too much to take at once, we are going to explain it step by step:
var Url = 'https://tile.sentinelmap.eu/2016/summer/rgb/{z}/{x}/{y}.jpg?key=<my-sentinelmap-key>';First we set the URL of the tiles from SentinelMap.
In this piece of code you have to substitute <my-sentinelmap-key> with your own SentinelMap Services' key.
Follow this walkthough to get started with the service and obtain your own key. Don't worry: the service is free up to 50,000 tiles per month. You can comfortably play around with it and get a map going for your own blog no problem!
var Attr = 'Modified <a href="https://scihub.copernicus.eu/">Copernicus</a>' +
	  ' Sentinel data 2016 by ' +
	  '<a href="https://www.sentinelmap.eu">SentinelMap</a>' ;
Next we set the map's attributions (this is needed as a requirement of the Creative Commons License).
var Layer = L.tileLayer(Url, {attribution: Attr});This line of code sets the base-map layer for your map. Leaflet, of course can manage adding more layers on top of it. Learn more on leaflet's tutorials, or stay tuned for more SentinelMap tutorials to come.
var map = L.map('map', {
	  center: [48.92, 11.25],
	  zoom: 5,
	  maxZoom: 14,
	  minZoom: 5,
	  layers: [Layer],
});
With this we create our map. We center it around the coordinates (48.92, 11.2), and set a zoom level of 5; we also set a min and max zoom (5 and 14) to match SentinelMap.eu's own tile range (remember: to-date the service does not yet cover the whole globe, only part of Europe). We then add the base-map layer we created, Layer. Notice how 'map' refers to the id of the <div> we previously set on the page.
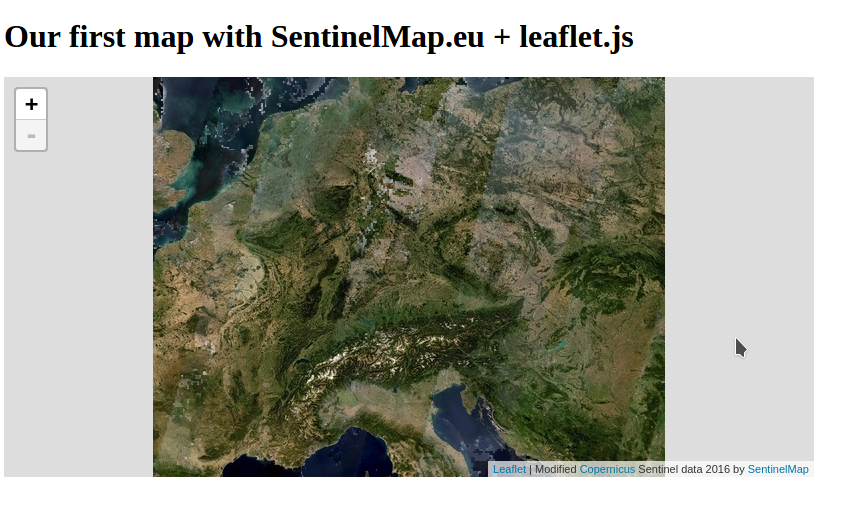
Our nice result:
This is the whole code:
<!doctype html>
<html lang="en">
  <head>
    <meta charset="UTF-8"/>
    <title>SentinelMap Quick Start</title>

    <link rel="stylesheet" href="https://unpkg.com/[email protected]/dist/leaflet.css"
	  integrity="sha512-07I2e+7D8p6he1SIM+1twR5TIrhUQn9+I6yjqD53JQjFiMf8EtC93ty0/5vJTZGF8aAocvHYNEDJajGdNx1IsQ=="
	  crossorigin=""/>

    <script src="https://unpkg.com/[email protected]/dist/leaflet.js"
	    integrity="sha512-A7vV8IFfih/D732iSSKi20u/ooOfj/AGehOKq0f4vLT1Zr2Y+RX7C+w8A1gaSasGtRUZpF/NZgzSAu4/Gc41Lg=="
	    crossorigin=""></script>

    <style>
     #map {
        width: 60%;
        height: 400px;
    }
    </style>

  </head>

  <body class="map-layout">
    <h1>Our first map with SentinelMap.eu + leafletJS</h1>
    <div id="map"></div>
	<script>
      var Url = 'https://tile.sentinelmap.eu/2016/summer/rgb/{z}/{x}/{y}.jpg?key=<my-sentinelmap-key>';
	  var Attr = 'Modified <a href="https://scihub.copernicus.eu/">Copernicus</a>' +
	  ' Sentinel data 2016 by ' +
	  '<a href="https://www.sentinelmap.eu">SentinelMap</a>' ;
	  var Layer = L.tileLayer(Url, {attribution: Attr});
	  var map = L.map('map', {
	  center: [48.92, 11.25],
	  zoom: 5,
	  maxZoom: 14,
	  minZoom: 5,
	  layers: [Layer],
	  });
	</script>
  </body>
</html>
You can also clone the git-hub repo, and find there some other interesting examples of use.