Pulsar Machine Learning Example: K Means - sedgewickmm18/microk8s-spark-pulsar-etc GitHub Wiki
The example builds on a library that implements sliding windows per device id and offers a Java interface to "plug-in" ML methods like
public class KMeansFunc implements MonitorFunctionSupplier {
...
@Override
    public MonitorFunction functionImpl() {
        return (Logger log, FunctionConfiguration configuration, List<FunctionInputEvent> inputEvents) -> {
            long start = System.currentTimeMillis();
...
}
The ML algorithm is supposed to run as part of the lambda expression
Since it is a windows function any implementation has to reassemble the window of individual events into a time series object. For this implementation I've chosen IBM's internal timeseries-insights library, because it offers easy to use methods for interpolating timeseries data to overcome unevenly space input as well as for cutting timeseries data into overlapping segments. However, plain Java collection classes or apache common math would do as well.
           for (FunctionInputEvent evt : inputEvents) {
                if (tenant == null) {
                    tenant = evt.getTenant();
                    deviceType = evt.getDeviceType();
                    deviceId = evt.getDeviceId();
                }

                JsonNode targetField = evt.getEventJson().get(inputField);
                windowObservations.add(new Observation<Double>(evt.getTimestamp(), targetField.doubleValue()));
            }
Leaving out interpolation to keep it simple
of length window_size with sliding by slide.
SegmentTimeSeries<Double> tsSnippets = ts_new.segment(window_size, slide);
MultiTimeSeries<Long, Double> mts = tsSnippets.flatten();
and turning it in a list of DoublePoint, a class provided by apache-common math.
List<DoublePoint> clusterInput = new ArrayList<DoublePoint>();
        mts.getTimeSeriesMap().entrySet()
                .forEach(ts -> {
                    clusterInput.add(
                            new DoublePoint(
                                    ts.getValue().collect().stream().
                                            mapToDouble(Observation::getValue).toArray() )
                    );
                });
Since common-math provides several clustering algorithms, K-Means++ among them, putting the list of vectors into clusters is very simple
KM_clusterer = new KMeansPlusPlusClusterer<DoublePoint>(30, 10000);
        clusterResults = KM_clusterer.cluster(clusterInput);
Note that we selected 30 clusters which doesn't have to be the optimal hyperparameters to begin with. Experience, however, has shown that 30-40 clusters is a realistic and useful assumption for anomaly scoring in our scenarios.
We follow [1] and partition the set of clusters into large and small clusters. For that we introduce to two additional hyperparameters alpha (default 0.9) and beta (default 5). After sorting the clusters by size in reverse order, starting with the largest, we sum up cluster cardinalities and stop when we've reached alpha percent of the overall amount of vectors.
        double alpha_sum = 0.0;
        for (index_alpha = 0; index_alpha < clusterResults.size(); index_alpha++) {
            alpha_sum += clusterResults.get(sortedIndices[index_alpha]).getPoints().size();
            System.out.println("Alpha_Sum: " + Double.toString(alpha_sum));
            if (alpha_sum > alpha) break;
        }
For the second hyperparameter we look at the ratio between two successive cluster cardinalities (in reverse order). If the ratio is larger than beta we conclude there is a sudden drop in size.
double beta_prev = 0.0, beta_act = 0.0;
        for (index_beta = 0;  index_beta < clusterResults.size(); index_beta++) {
            beta_prev = beta_act;
            beta_act = clusterResults.get(sortedIndices[index_beta]).getPoints().size();
            System.out.println(Integer.toString(index_beta) + "  ,  " +
                    Double.toString(beta_prev) + " , " + Double.toString(beta_act));
            if (beta_prev > 0 && beta < beta_prev / beta_act) {
                break;
            }
        }
Both approaches find the index for the largest small cluster, for the purpose of this algorithm we continue with the smaller index.
The anomaly score for each vector now depends on whether it is member of a small or a large cluster. In case of a large cluster the score is just the distance to the cluster's center; for members of small cluster we use the minimal distance to all centroids of the large clusters.
Now all it takes is to turn the anomaly score timeseries data into a LinkedList of JSON encoded events.
            final String tenantf = tenant, devTypef = deviceType, devIdf = deviceId;
            anomaly_ts.collect().stream().map(obs->output.add(outputCfg.createOutput(
                    tenantf, devTypef, devIdf,
                    obs.getTimeTick(),                      // timestamp as long
                    DoubleNode.valueOf(obs.getValue()) )));  // value as double
Anomaly scoring is run in a separate method that takes pulsar independent arguments, in our case a TimeSeries<Double> object along with hyperparameters.
This allows to run unit tests against the scorer independently of pulsar.
All it takes is to load test data in Junit's BeforeAll step with
      ts = TimeSeries.csv(
                        AZURE_ANOMALY_FILE,   // Azure's open sourced anomaly test file
                        "timestamp",
                        true,
                        true,
                        ",",
                        DateTimeFormatter.ofPattern("yyyy-MM-dd HH:mm:ss"))
                .map(x -> Double.valueOf(x.get("value")));
call the anomaly score method directly and compare the results.
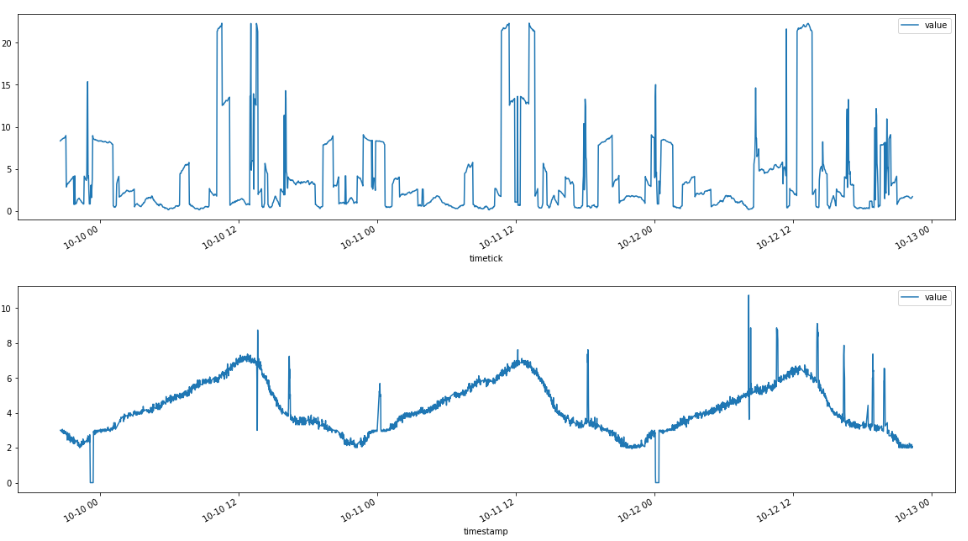
(Anomaly score above, "Raw" Test data below)
[1] Zengyou He, Xiaofei Xu, and Shengchun Deng. Discovering cluster-based local outliers. Pattern Recognition Letters, 24(9-10):1641–1650, 2003.