Bugfix Issue 862 Dashboard Schema Drift Guard - sebiboga/testlink-upgraded GitHub Wiki
Bugfix Issue #862 — "Failed to load dashboard." (schema-drift guard, Refs #841)
Problem
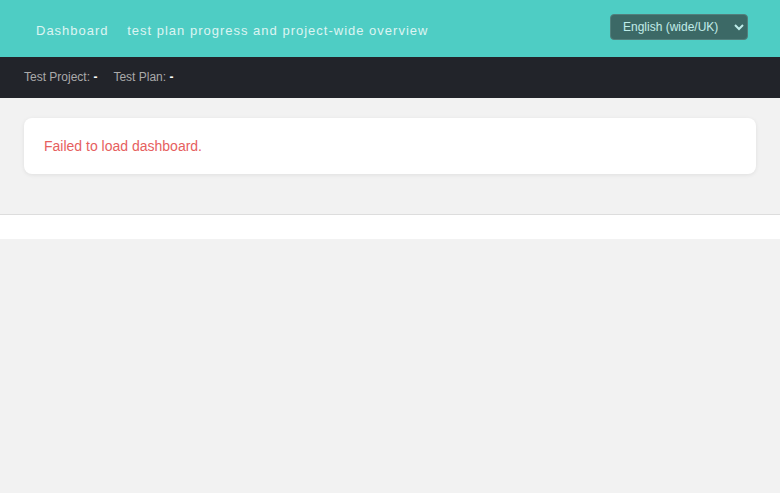
The dashboard (modernized screen) showed the warn box "Failed to load dashboard."
on a reportback. The BFF GET /api/mainpage/index.php?tproject_id=1&tplan_id=12
returned HTTP 200 but the body was raw HTML (DB Access Error - debug_print_backtrace() OUTPUT START), not JSON.
Root cause (file:line chain, reproduced with a renamed column)
api/mainpage/index.php:94getDashboardData()->:148$tplanMgr->getNumberOfBuilds($tplanID).lib/functions/testplan.class.php:2429-2431buildsSELECT count(id) ... FROM builds WHERE builds.testproject_id = <projectOfPlan>.builds.testproject_idis a recent additive migration (14b6f673d, Refs #826 "scope builds to test project"). A 1.9.20-era database has onlybuilds.testplan_id, so the SQL fails:Unknown column 'builds.testproject_id'.lib/functions/database.class.php:190-214exec_query()echoes an HTML "DB Access Error" trace and callsdie()on any SQL failure. The process dies mid-request.mainPage.htmlloadData()requests with jQuerydataType:'json'; the HTML body fails to parse ->error:callback ->$t('dash.errLoad')("Failed to load dashboard.") —gui/templates/mainpage/mainPage.html:166-170.
This is the identical mechanism as the earlier #841 (same collapse on the same
SQL). #841 hotfixed by flipping the query to builds.testplan_id (commit
eb4df8315); the migration 14b6f673d + reader rewrites (6b50b996c) moved the
code back to testproject_id. Correct on a migrated DB, fatal on any instance
that has not run the migration — the reporter's instance.
Fix (commit ec457b9c6) — graceful degradation in the BFF
In api/mainpage/index.php:
- New helper
bffBuildsSchemaOk($db)probesINFORMATION_SCHEMA.COLUMNSfor{DB_TABLE_PREFIX}builds.testproject_id. The probe reads only a system view and references trusted config constants (never the migrated column), so it is effectively un-failable and cannotdie()in practice. - The
GET /route runsgetDashboardData()only when the probe returns true; otherwise the execution-status widget is skipped (dashboard: nullin the payload) and the rest of the dashboard still renders.
Rationale: die() inside exec_query() cannot be caught with try/catch, so the
BFF must prevent the failing query from running. The probe mirrors the existing
graceful-degradation pattern of the ITS widgets (a missing/down tracker never
kills the whole payload).
Why not other approaches
- Change
getNumberOfBuilds()back tobuilds.testplan_id(as #841 did): rejected — project-scoping is the deliberate direction (Refs #826/#503/#834); reverting shifts semantics for 6 call sites (reports, mainPage, frmWorkArea, xmlrpc, resultsByTesterPerBuild). - Make
exec_query()throw instead ofdie(): rejected — global legacy behaviour change, huge blast radius.
Verification (CI: MariaDB 127.0.0.1:3306, TestLink @ http://localhost:8082)
- Restored schema: full render — "Test Plan: DASH Plan · Completed: 100.0% (3/3)" (1 passed / 1 failed / 1 blocked), bugs + growth + Project open issues widgets render, all API calls 200 JSON, no warn box.

- Drifted schema (column renamed to
testproject_id_missing): HTTP 200 with valid JSON{"status":"ok","dashboard":null,...}, header populates, the execution-status widget degrades to "No records found / Total 0", the other widgets still render, no "Failed to load dashboard." warn box. - Async
/bugsTestedroute still returns 200 valid JSON on both schemas. - Event Viewer: zero new Error/Warning entries (also fixed a malformed ITS
cfgin the repro fixture that emitted E_WARNINGs fromsimplexml_load_string).
Files
api/mainpage/index.php—bffBuildsSchemaOk()+ guardedGET /route.docs/screenshots/issue-862-dashboard-failed.png— pre-fix symptom.docs/screenshots/issue-862-dashboard-fixed.png— post-fix full render.