Examples Simulation - samchon/framework GitHub Wiki
Samchon Simulation Cloud is my private solution not publishing source codes, however, I introduce this Samchon Simulation Cloud as top of example projects using Samchon Framework. Any solution can't represent Samchon Framework much better than this Samchon Simulation Cloud.
The Samchon Simulation Cloud is a cloud solution for:
- Inquirying corporate
- Price and summarized information
- Financial statement & index
- Comparison
- Retrieving corporations with specified condition via Nam-Tree.
- Simulation
- Deduct the optimal trading condition via Nam-Tree and Back-testing.
- Future Price with Montecarlo Simulation.
- Those're all for Automatic System Trading.
Reading the manual and using the provided demo, how about estimating which modules are used in which parts.
-
Library
- XML
- Case Generator
- Genetic Algorithm
- EventDispatcher
- Virtual File Tree
- HTTP Loader
- Protocol
- Nam-Tree
- Library
- Virtual File Tree
- Protocol
- Standard Message
- Cloud Application
- Nam-Tree
-
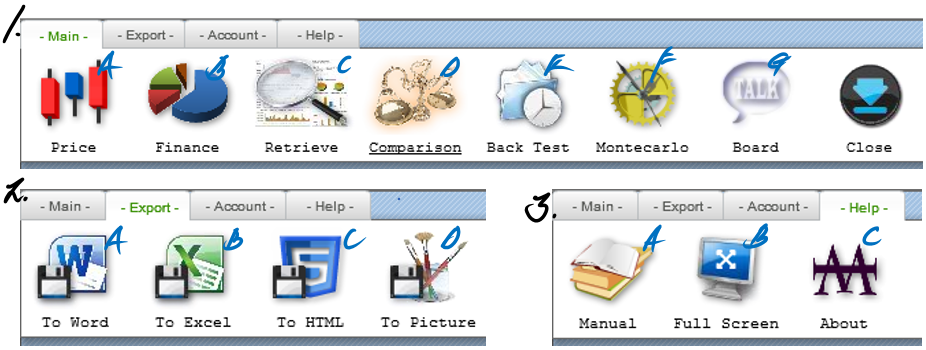
Main: If you click a buttion in Main, new window will be opened. - A. Price
- Inquiry stock price
- Inquiry summarized financial information
- B. Finance - Inquiry financial indices
- Inquiry financial statements
- C. Retrieve - Find matched corporation via Nam-Tree
- Condition in Retrive can be used in Back-Testing - D. Comparision
- Compare relative price
- Compare financial indices - E. Back Test
- Deduct best trading condition via Back Testing
- The trading condition is composed with Nam-Tree
- The trading condition can be automatically compowsed via exploration - F. Montecarlo
- Montecarlo Simulation
- Predict future price
- Reference distribution (risk) for determination - G. Board
-
Export: Export current's screen or data to document. - A. To Word -> *.doc - B. To Excel -> *.xls - C. To HTML -> *.html - D. To Picture -> Screenshot and save as *.png
-
Help - A. Manual -> Samchon Simulation Cloud Manual - B. Full Screen -> Convert screen to full-size - C. About -> Information about Samchon Simulation Cloud and developer Jeongho Nam
-
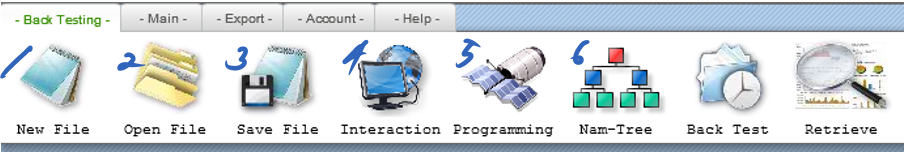
New File: Initialize the simulation configurations - Iinitialize configurations of simulation.
-
Open File - Load simulation configurations.
-
Save File - Save current's simulation configurations. - It doesn't mean result of simulation but parameters for execution.
-
Interaction - Get simulation settings from external program that user specified. - This program (Samchon Simulation Cloud) sends historical data, to external program, which will be used to deduct simulation configurations. The external program sends simulation configurations again and the simulation begins.
-
Programming - Sinluation configurations are derived from user-defined programming code (script). - User writes the programming code, and Samchon Simulation Cloud compiles it and the compiled program will follow steps in 4. Interaction.
-
Nam-Tree - Deduct configurations via Nam-Tree.
-
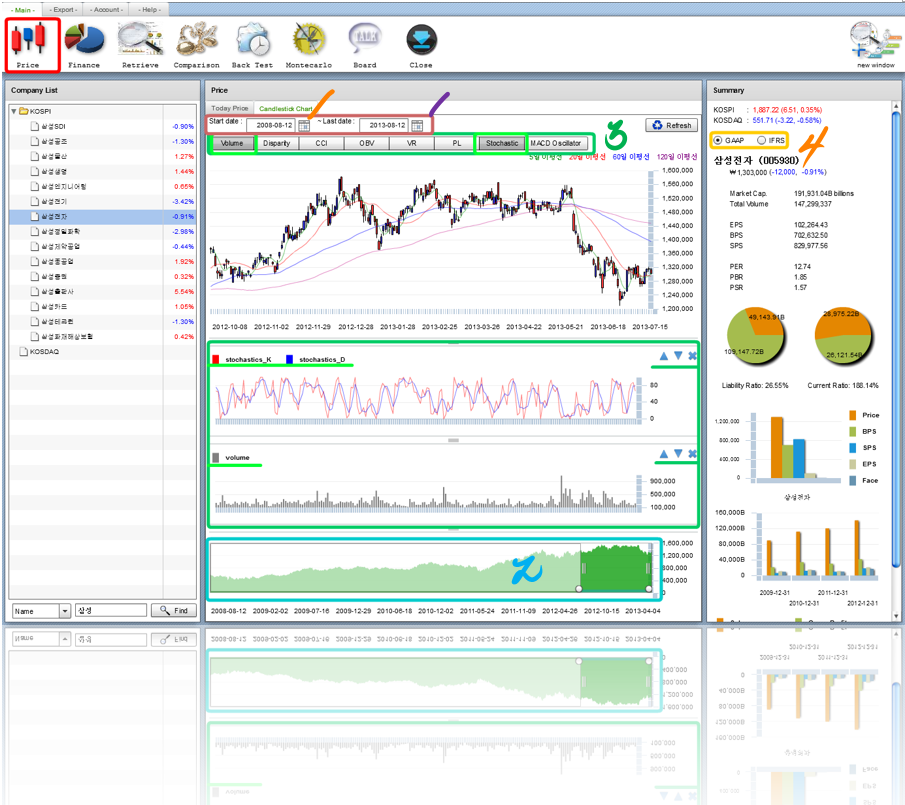
Date range of price data - Starting date ~ final date
-
Minimap Chart - You can resize or move the main candle chart by moving or resizing the minimap chart.
-
List of technical indices - You can add or pop technical charts by clicking those buttons. - Of course, you also can swap the position between those technical charts.
-
You can select a financial standard for summarized financial information.
-
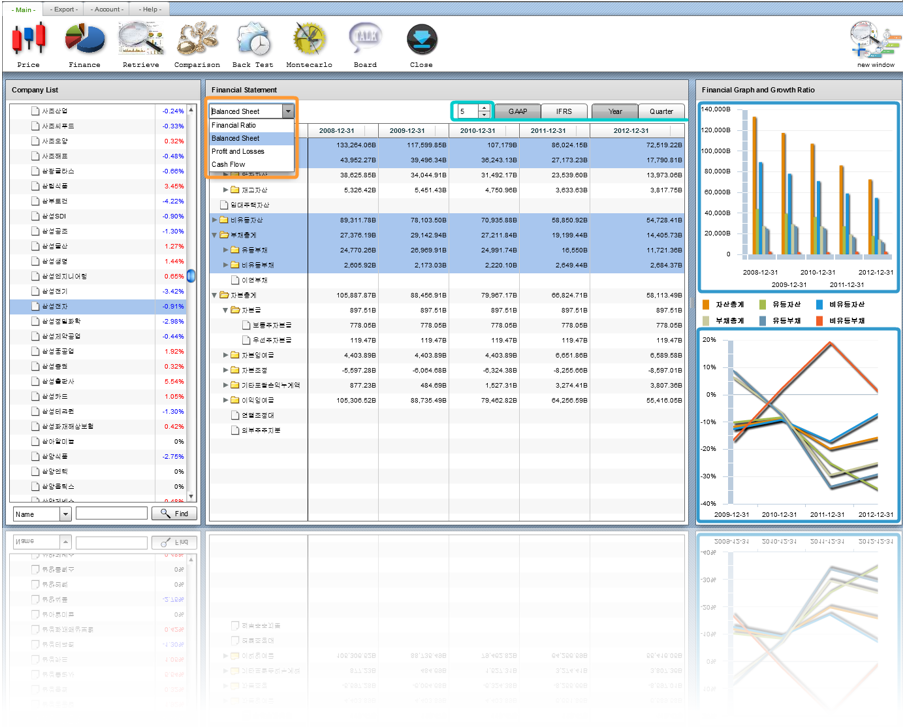
You can set the type of financial statement. - Financial indices - Profit & Losses - Balanced Sheet - Cash Flow
-
You can set the standard and period of financial statement. - Standard: GAAP & IFRS - Period: Year & Quarter
-
You can select multiple accounts (rows) on report. If you select, then line charts are drawn. - Top graph: Original data - Bottom graph: Growth ratio compare with before (T / (T-1))
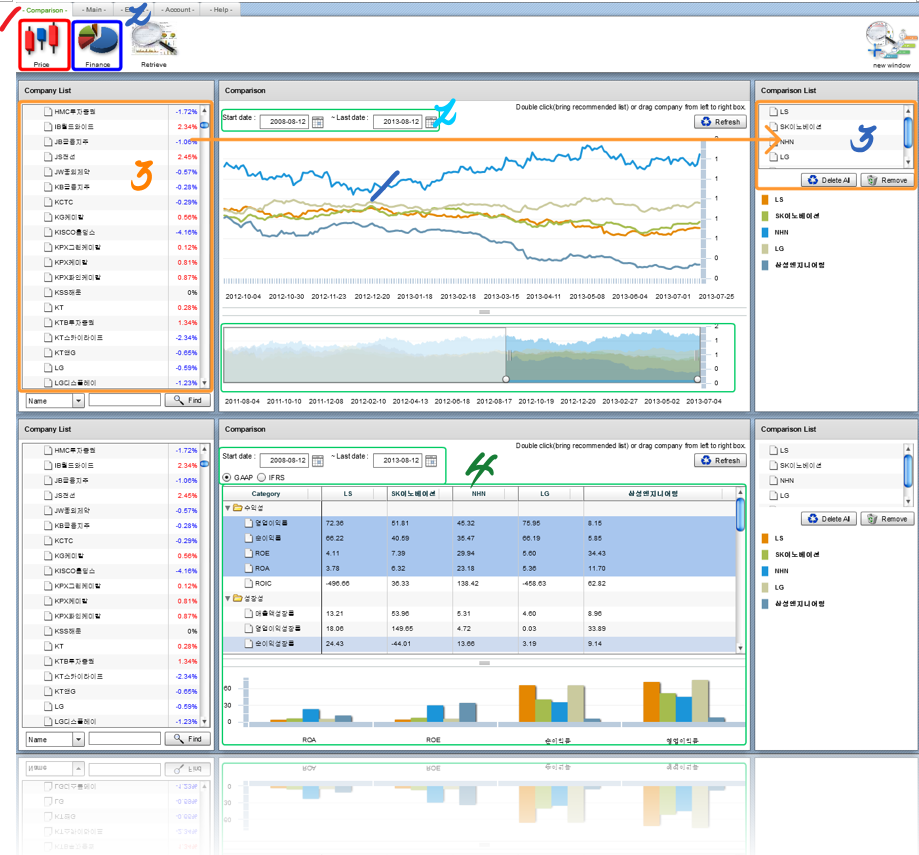
- Compare relative price
- Compare relative financial indices
- Drag corporations from left grid to right what you want to compare. If you double click a corporation in left grid, recommended comparison list will be loaded.
- Price data range and financial standard to be compared.

Like the picture on top, data is inserted into Nam-Tree, and through the filtering out, and return the result. This Nam-Tree's shape and structure is seemed like a decision-tree.
Before utilization, let's ssee the composition principle.
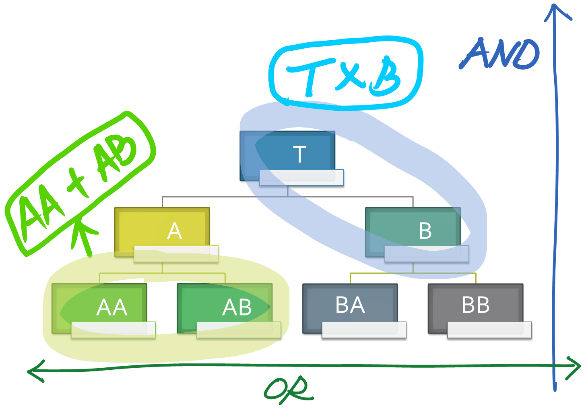
AND condition between different level, same level under a same hierarchy is OR. But in fact, not AND or OR condition, but X (multiply) condition between different level which is expressed as parent and child relationship, + (plus) conditions between same level under the same parent.

Each element is a criteria:
- [Left Side] [compare expression] [Right side]) ? 1 : 0
If the condition is true, then returns 1. Else then returns 0.
As I've mentioned, each criteria’s condition is right, then return 1, else false 0. If you add a weight in here then return (1 X Wi) when true, false is 0, too.
- [Left Side] [compare expression] [Right side]) ? Wi : 0
You can reflect importance by this weight, and you can even adjust minus weight so that you can reflect minus weight (reverse importance), too.
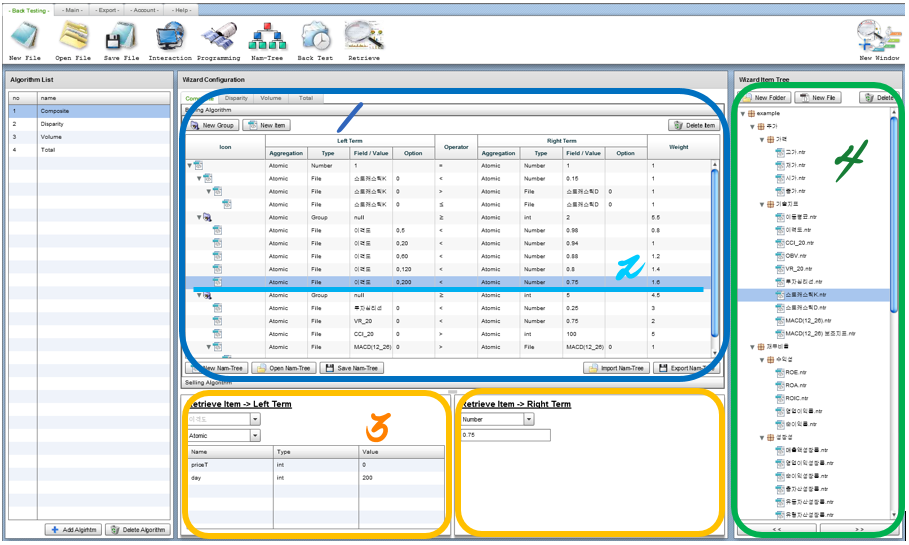
You can insert not only value to each side, but also user defined function (programming code) so that makes express dynamically.
If you set a side to explore, then Samchon Simulation Clloud finds the optimization value It can be used usefully in Back-testing.
-
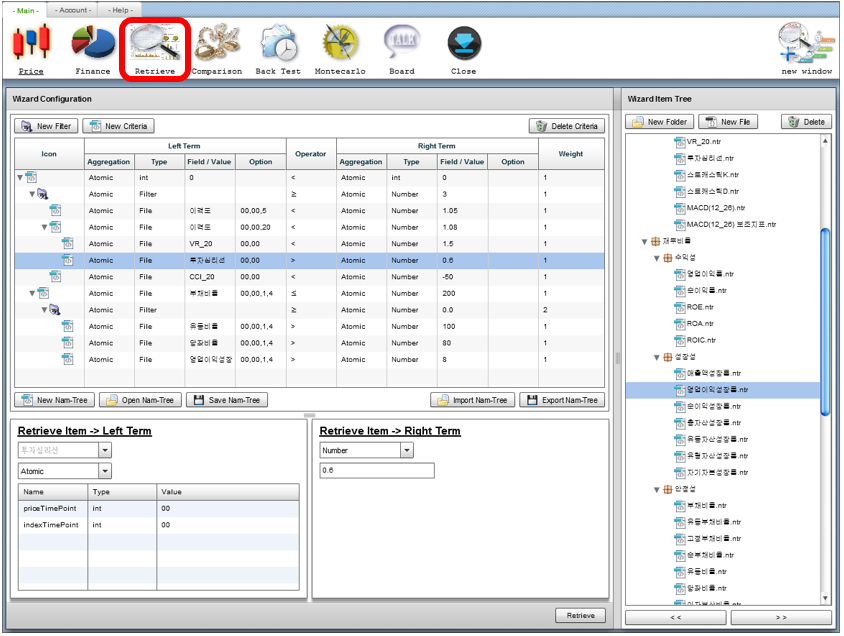
Nam-Tree Grid - A hierarchical grid expressing Nam-Tree’s tree structure.
-
Nam-Tree criteria (A record) - Each criteria in Nam-Tree is matched with a record in grid. - Like the top picture, if you select a criteria (record) then, 3. Left side and 3. Right side are displayed in 3. Parameter container.
-
Parameter container - Display the left side and right side of 2. Nam-Tree criteria which is selected. You can edit each side in here.
-
User defined function list - I told you that you can insert not only value to each side, but also user defined function (programming code) so that makes express dynamically at a page before. - This is the user-defined function list and you can adjust the functions to 3. Each side in 2. Criteria.
-
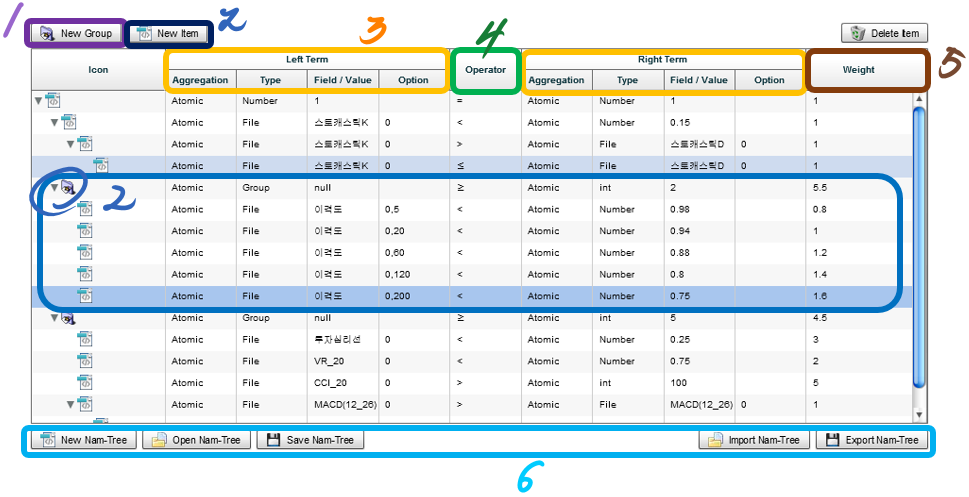
New Filter - Add a filter under the selected criteria. - This filter acts like this expression:
- (Criteria result from the children [_compare expression_] [Right side]) ? Wi : 0
-
New Criteria - Add a new criteria under a selected criteria.
-
Left Term and Right Term - Display selected criteria’s left and right side.
-
Operator - Display compare expression (>, <, ==, >=, etc.) - You can directly change the compare expression by clicking it.
-
Weight - Display the weight on each criteria. - Like the 4. Operator, you can edit it directly in grid’s record.
-
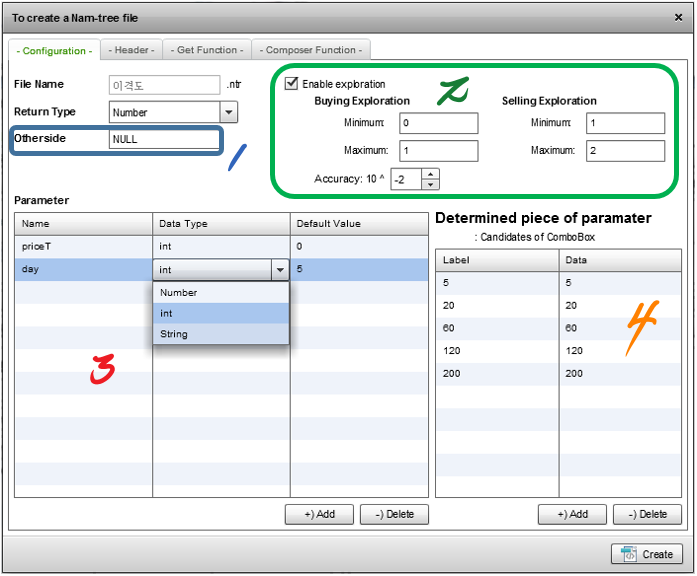
Initialization, opening, saving files, etc.
-
Opposite item - You can define opposite item as a pair. - If this opposite item is set up and when you input this function to a side, then this opposite function will be inserted into the other side automatically.
-
Explore configurations - Configurations for optimization.
- Minimum and Maximum value
- Accuracy
-
Parameters - Set parameters. - Components of parameter
- Name
- Data type
- Initial value.
-
Determined parameter candidate list - You can set candidate set for parameter. - Those candidates will be shown items in a ComboBox.
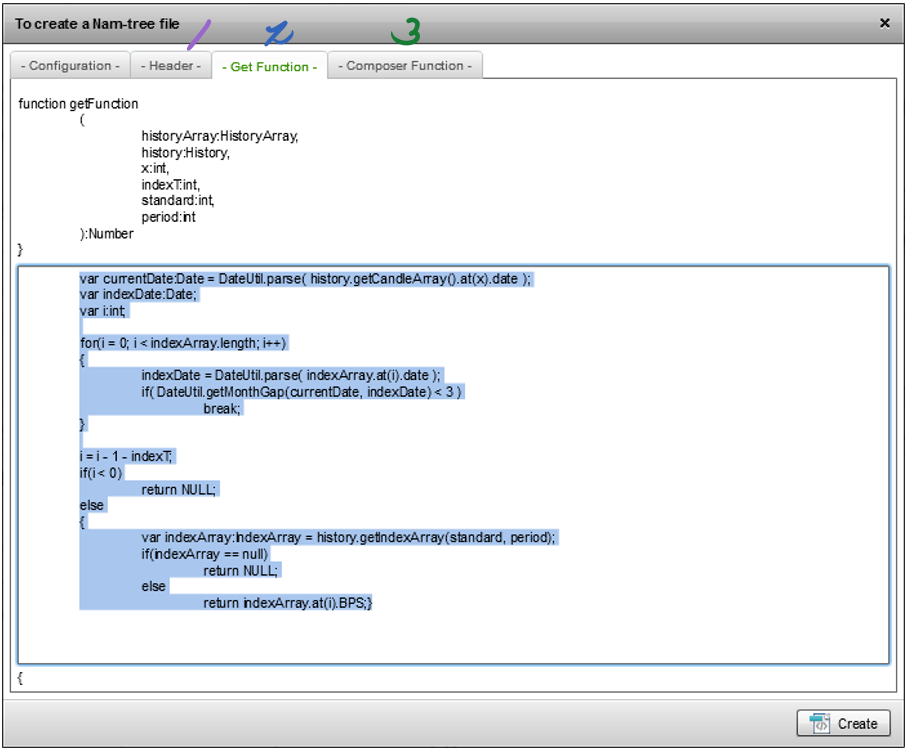
Insert user-defined function code.
-
Header - A code that will be run after compiled rightly.
-
Get Function - A function that will be called by criteria’s a Side.
-
Composer Function - A function that will be called when 2. Get Function was called first.
Sum of weighted value is over 3 IN
(
	Disparity 5 is less than 1.05, +
	Disparity 20 is less than 1.08 AND
	(
		VR 20 is less than 1.5 OR
		Psychological Line (PL) is over 0.6
	) +
	CCI 20 is less than -50
)
OR
Debt ratio is under 2.0 (200%) AND
	Matches over 2 IN
	(
		Liquidity ratio is over 1.0 (100%),
		Quick ratio is over 0.8 (80%),
		Operating profit growth ratio is over .08 (8%)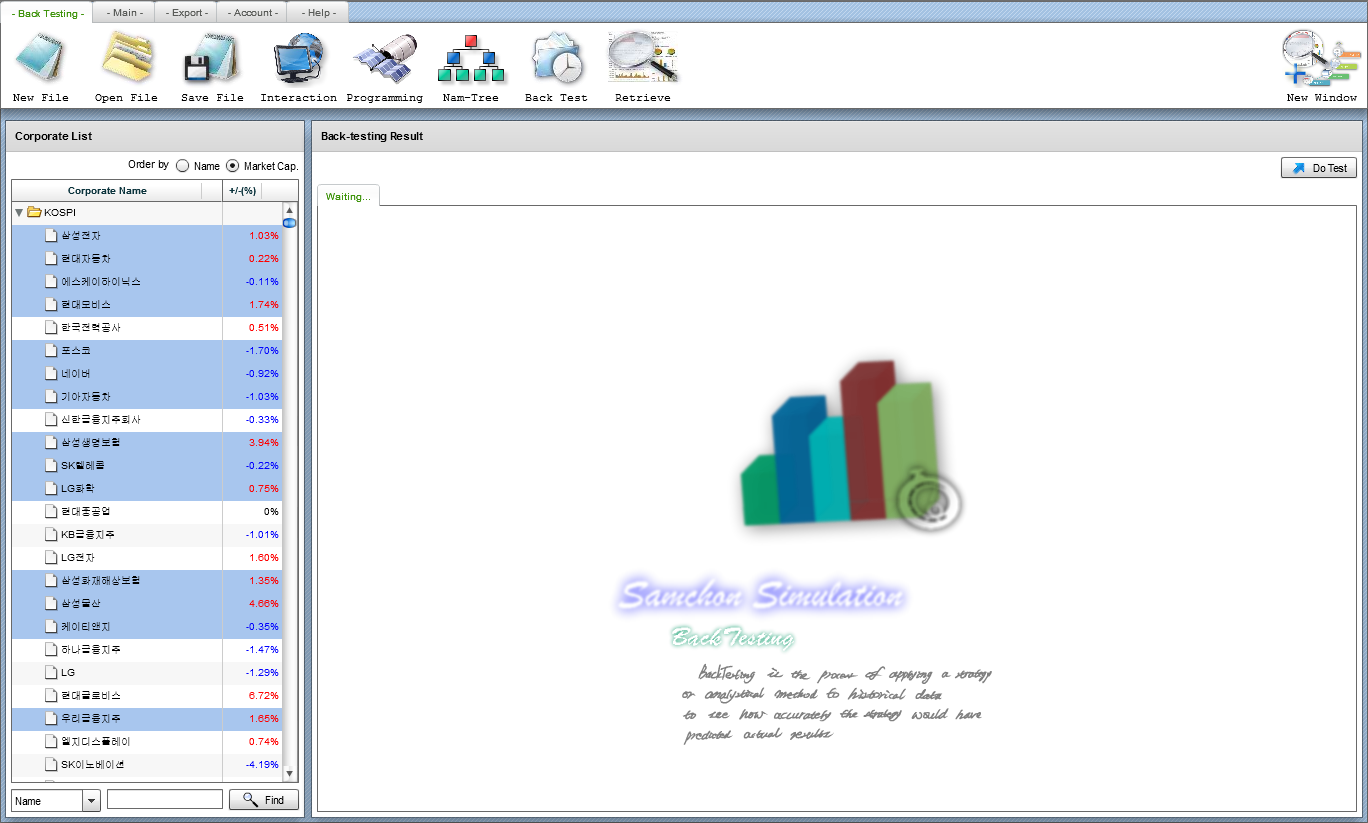
)Back-testing means act a virtual trading not to now but to previous time point. It is used to proof one’s own algorithm may be effective or deduct optimized algorithm to use real-trading.
 |
 |
|---|---|
| Select an interaction used to trading. | Select target corporations and click “Do Test”. |
 |
 |
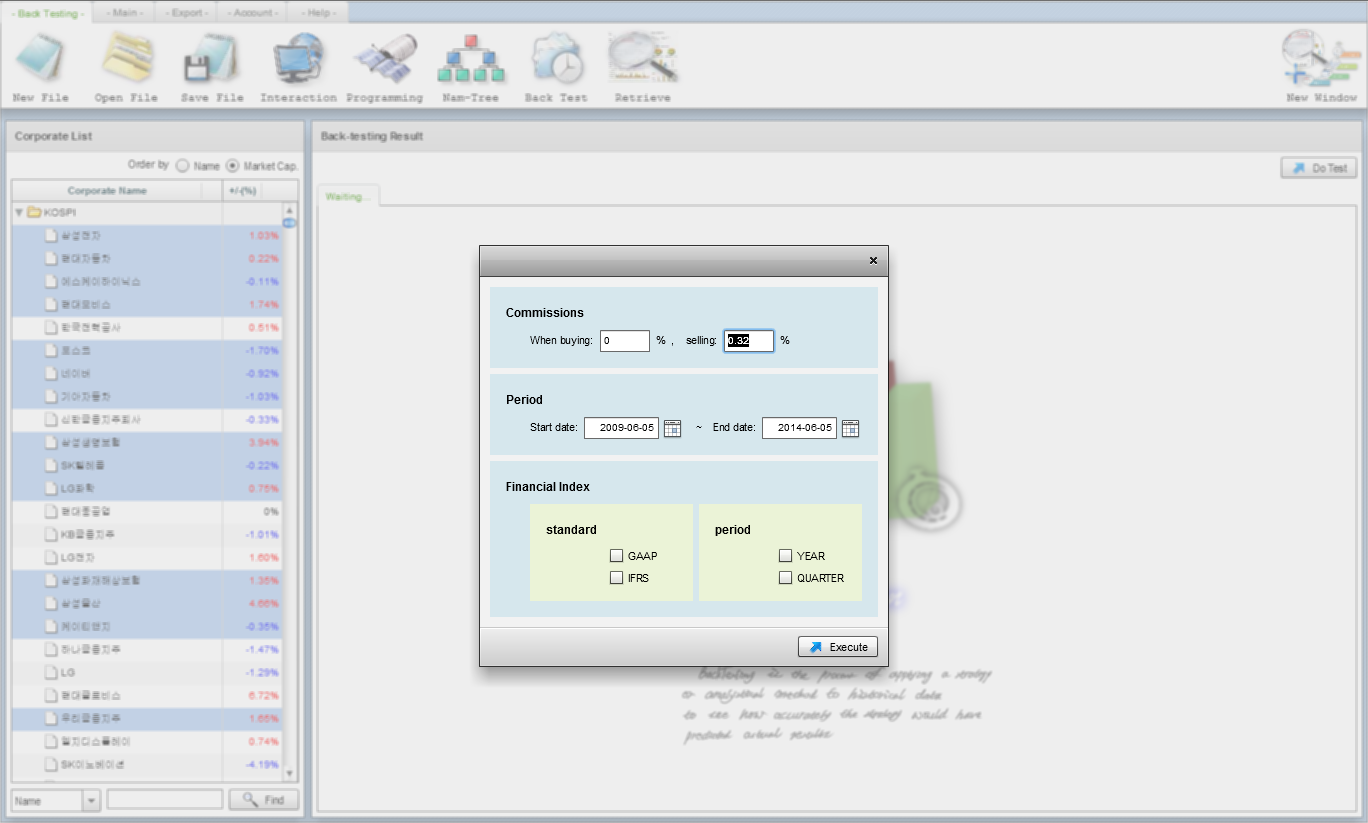
| Set configurations and click “Execute”. | After simulation is finished, the result screen comes. |
Back-testing supplies three types of interaction
-
Interaction - Trade by user-determined external program
-
Programming - Trade by user-defined programming code. - If you create a programming file, then example code is already wrote in. - Comprehend by the example code.
-
Nam-Tree - Trade by Nam-Tree - Filtered out value by Nam-Tree means the trading volume.
- Preliminary Buying & Determined Buying, Selling
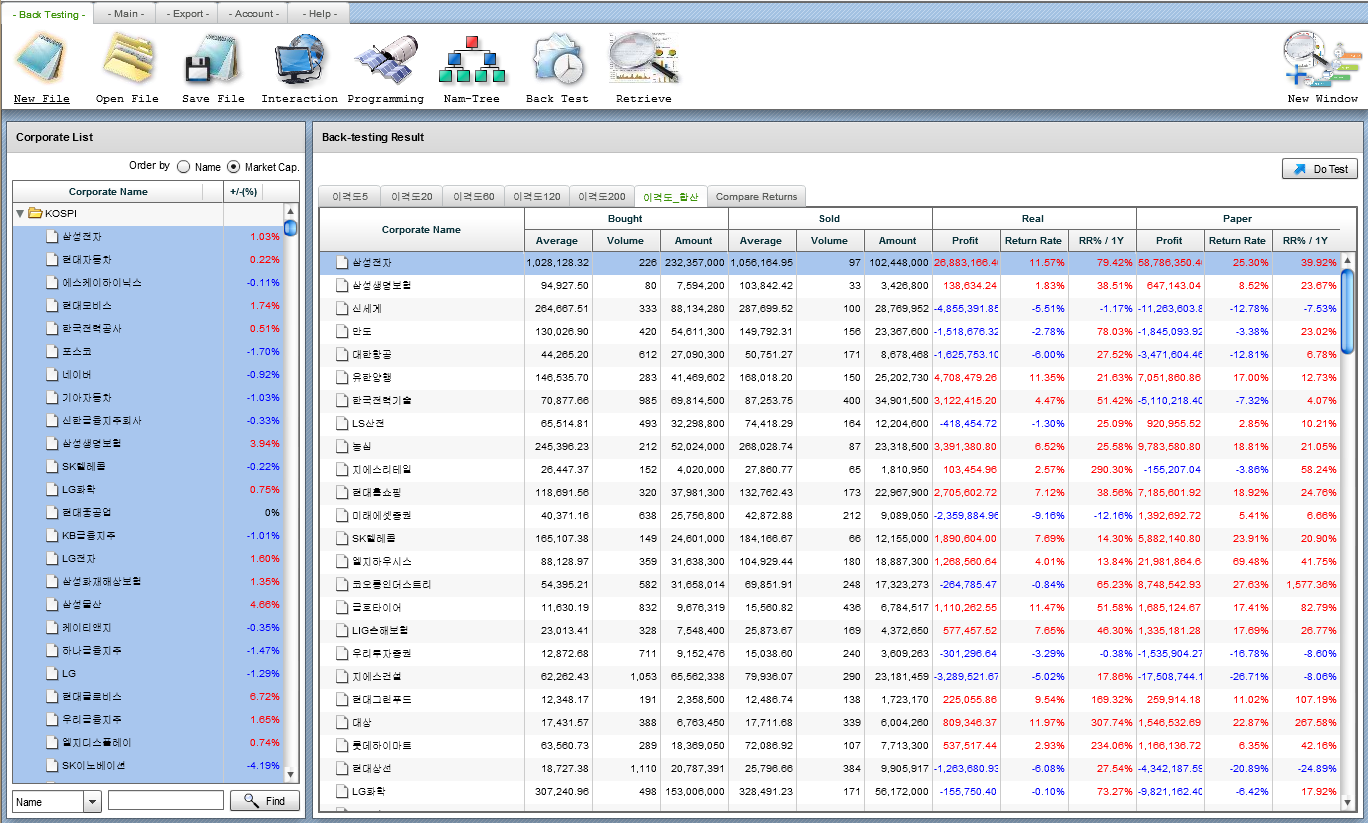
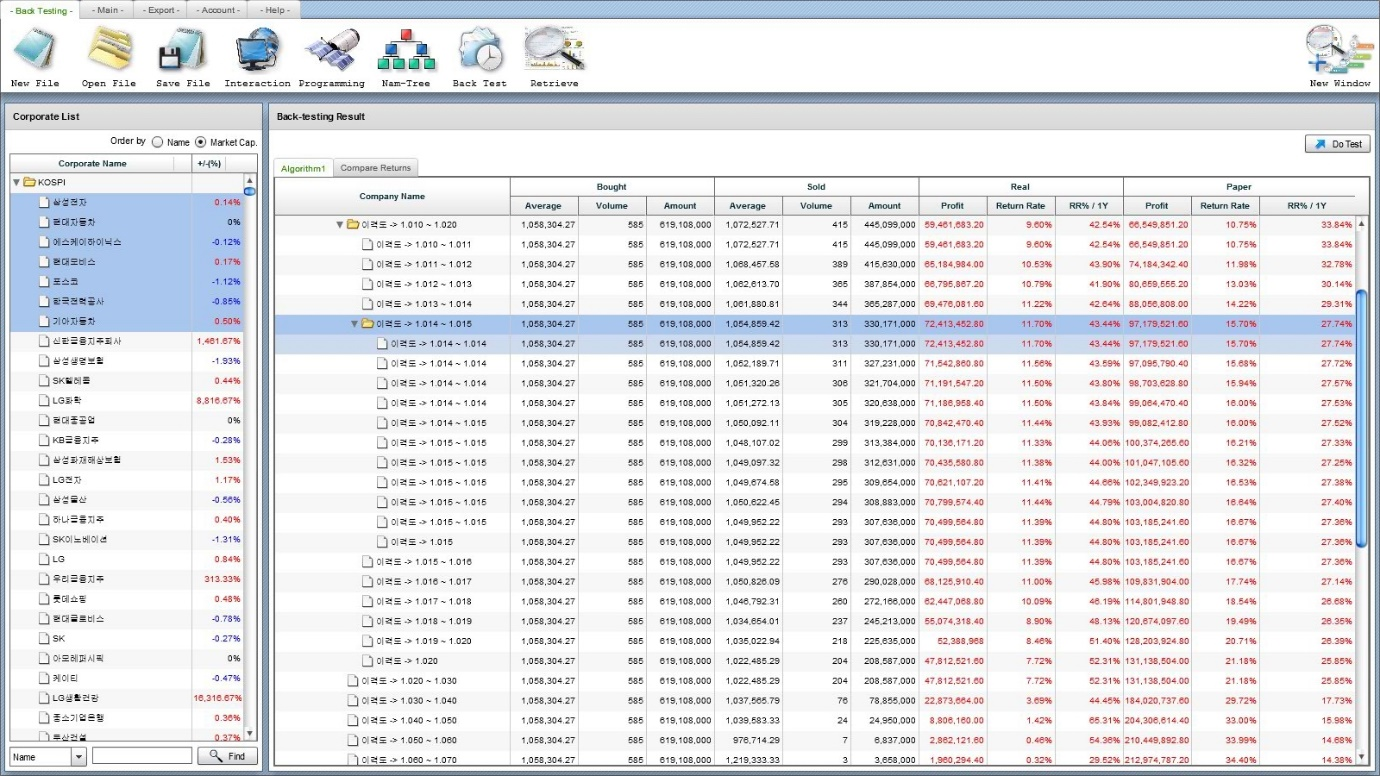
Displays trading result on each algorithm.
- Value & Volume (Bought, Sold)
- Normal return and hypothesis return for real and nominal return.
If you double-click a record, then you can see the Detailed-transaction Candle chart.
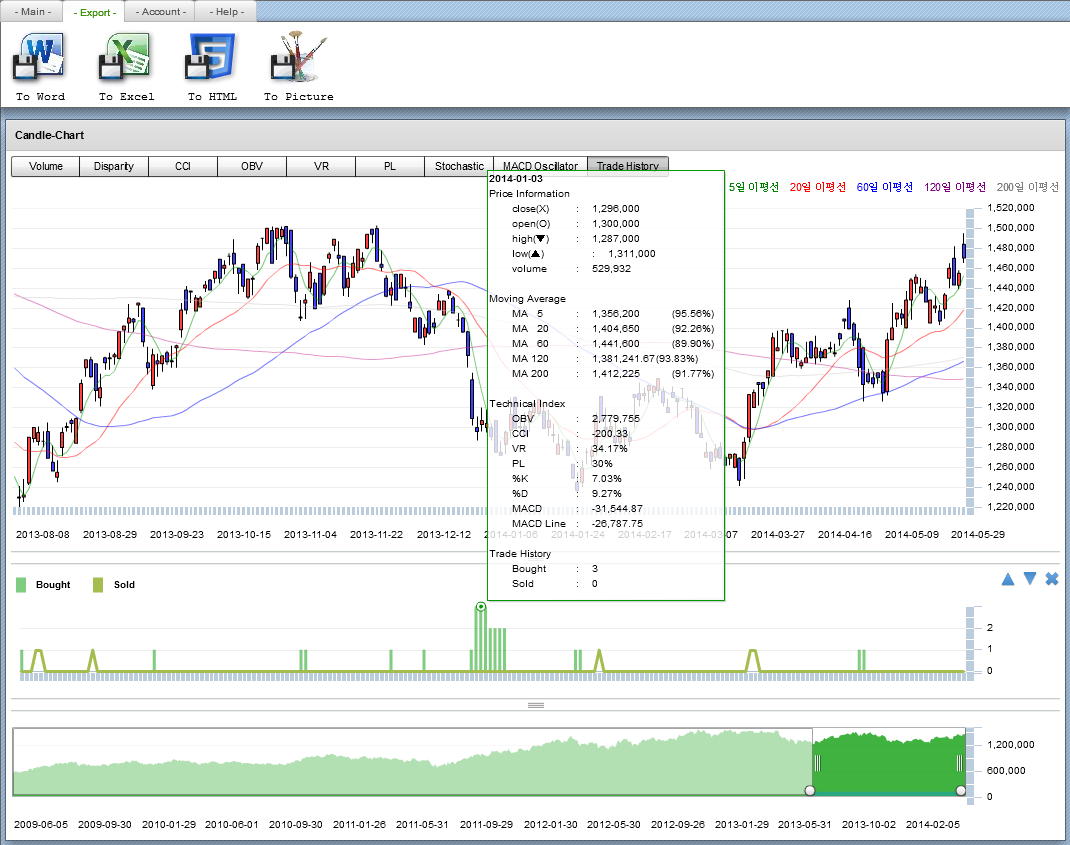
This is opened when you double-click a record from Return grid.
It’s almost seemed like the Candle chart what we have seen in Inquiry – Price. The only difference with it is Detailed-transaction Candle chart has a new index, “Trade History”
Of course, you can export this chart to document or save screenshot.
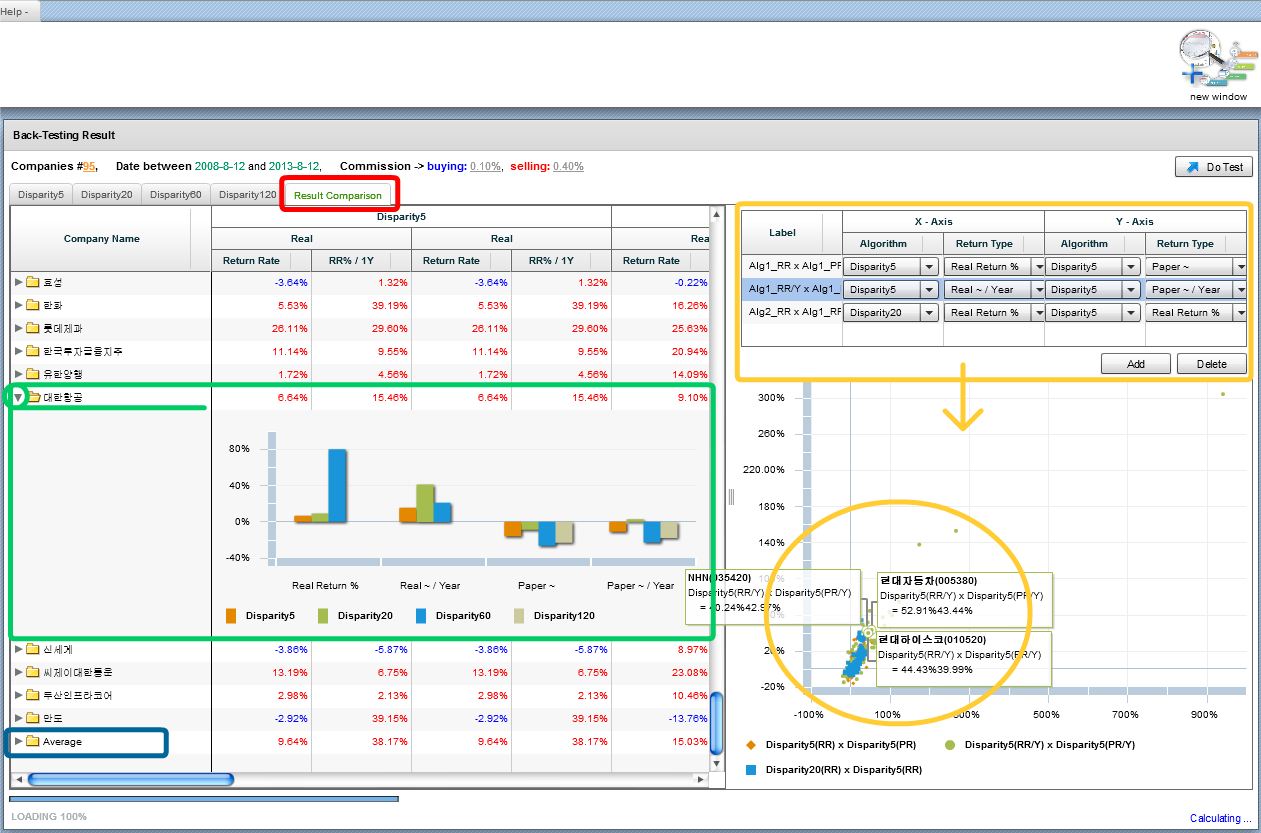
If you click the button “Result Comparison” of last tab menu, you can see all algorithm’s return visually and efficiently. This is the reason why this back-testing system can test multiple algorithms at once, for the visualization.
-
If you open a folder of a record, then a column chart will be opened. - In this case, you can compare a corporate return with multiple algorithms.
-
You can see plot chart of return’s distribution for each algorithm. - You can the series of plot chart by setting up in orange circled grid-combo box. - Set algorithm name and return type to each-axis.
-
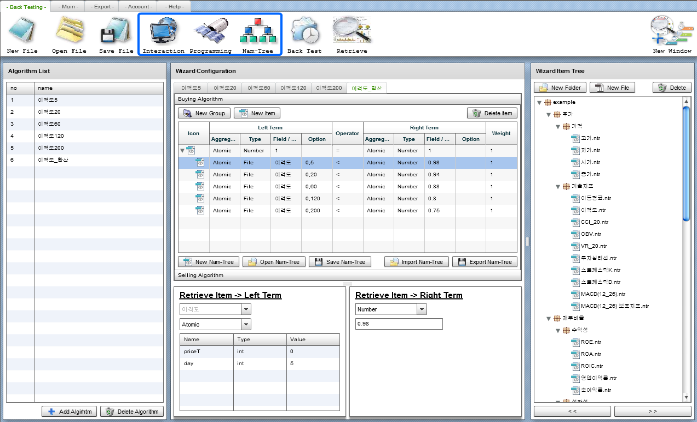
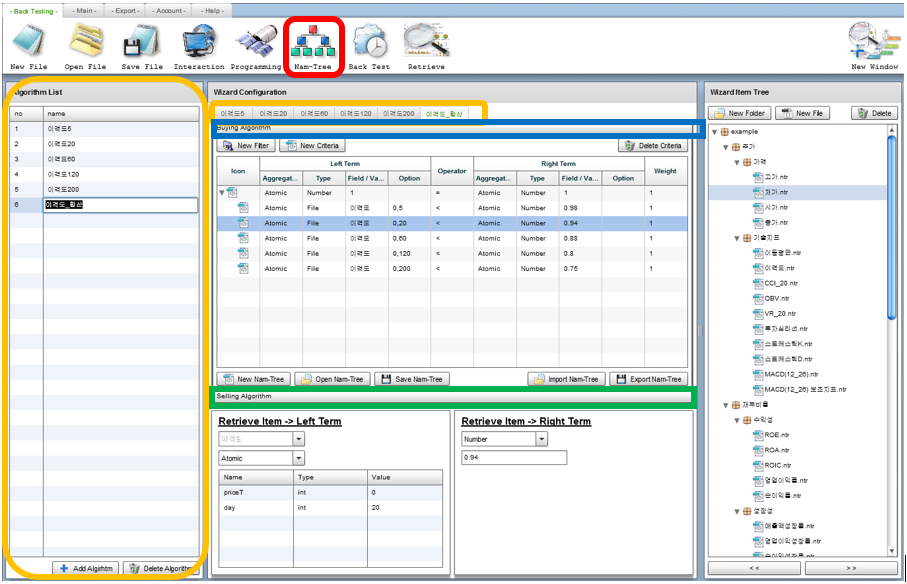
Algorithm List Grid - Back-testing supports multiple algorithm simulation at once as we’ve seen. - This grid is for the multiple algorithm simulation. Each record means a trading algorithm.
-
Back-testing Nam-Tree for each algorithm - Each algorithm pairs with a tab-navigator’s tab. Of course, there’s a Nam-Tree set for each algorithm and tab-navigator’s tab.
-
Nam-Tree for Preliminary Buying - Nam-Tree for preliminary buying. - In Back-testing, deduct a candidates first and determine whether to buy or not by the next step, determining.
-
Determined Buying
-
Nam-Tree for Selling
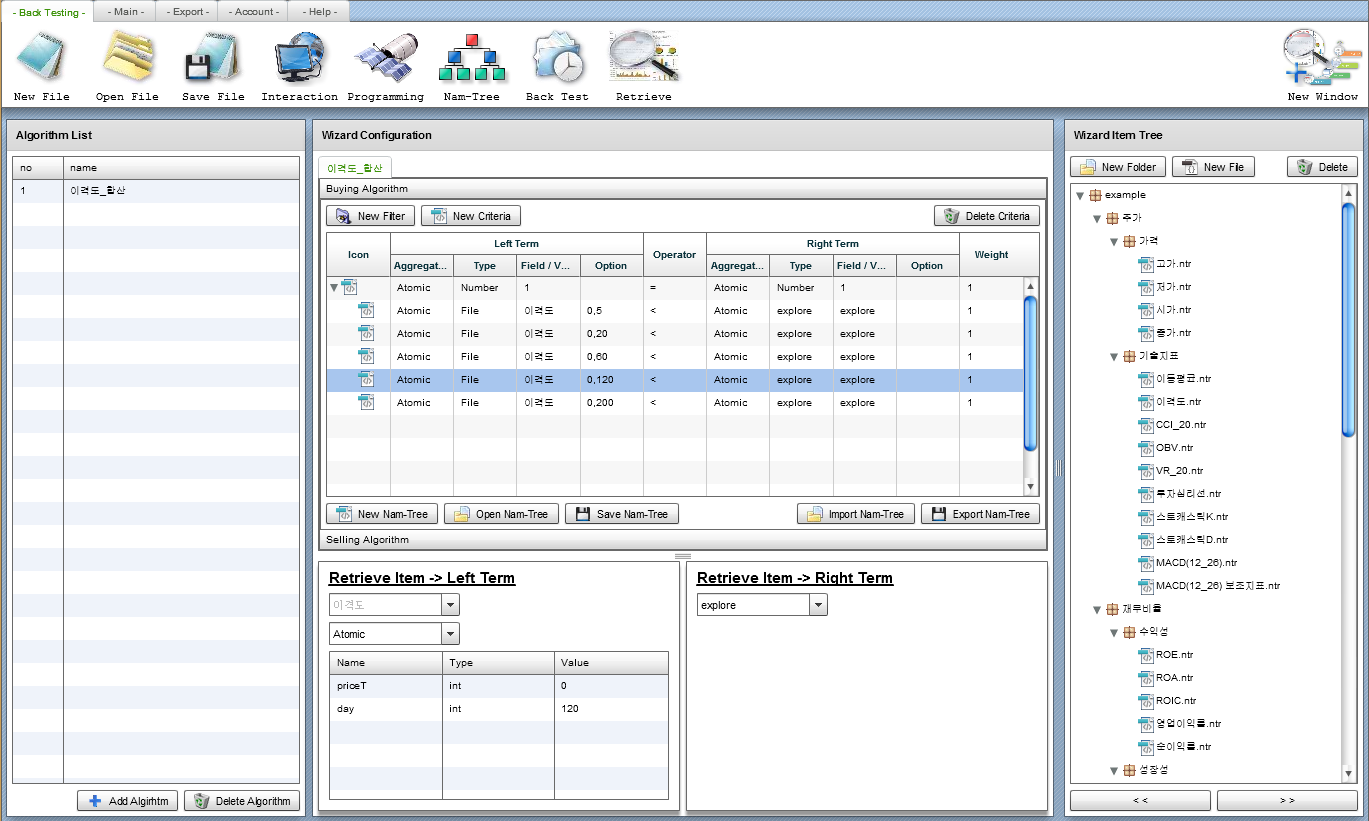
In back testing, you can optimize trading condition by the function, “explore”.
Set a Side to explore, then Samchon Simulation will retrieve the optimization value.
Additionally, you can see the exploration path like bottom picture.
Assumes that price moves as random walk and the random walk follows normal distribution, generate future price by simulation several times (at least 1,000), deduct the distribution of simulated price.

Wt means norm.s.inv(rand()) in excel, which means random variable follow normal distribution Z(0, 1), inverse function of cumulated normal distribution.
The value user have to input is the mean and standard deviation.
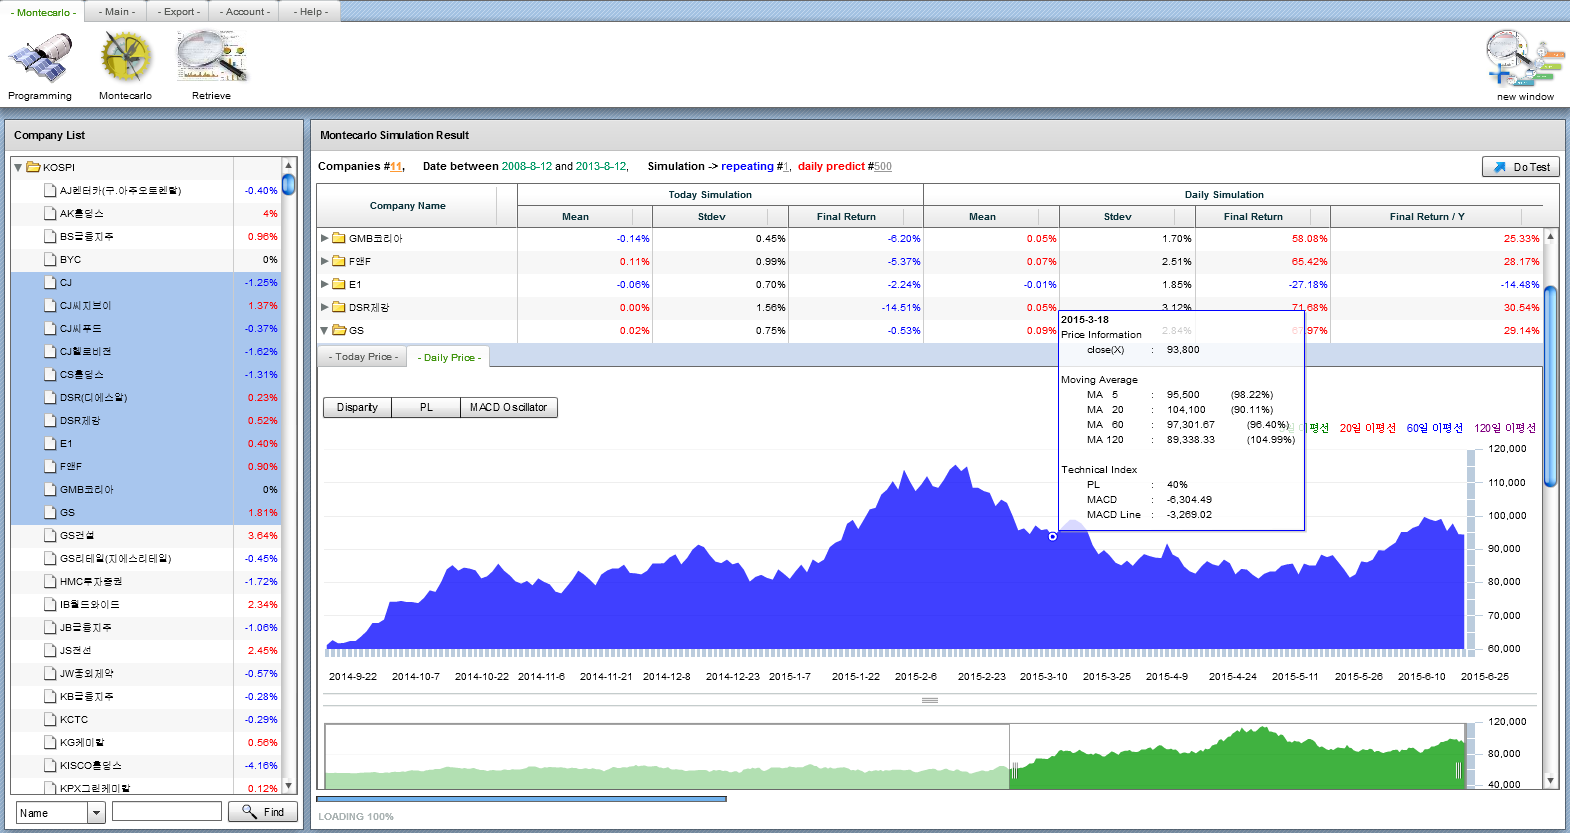
After simulation, you can see the mean, standard deviation of not user inputted, but result of simulated set. Also, of course, if you double-click the record, then you can see the detailed-.
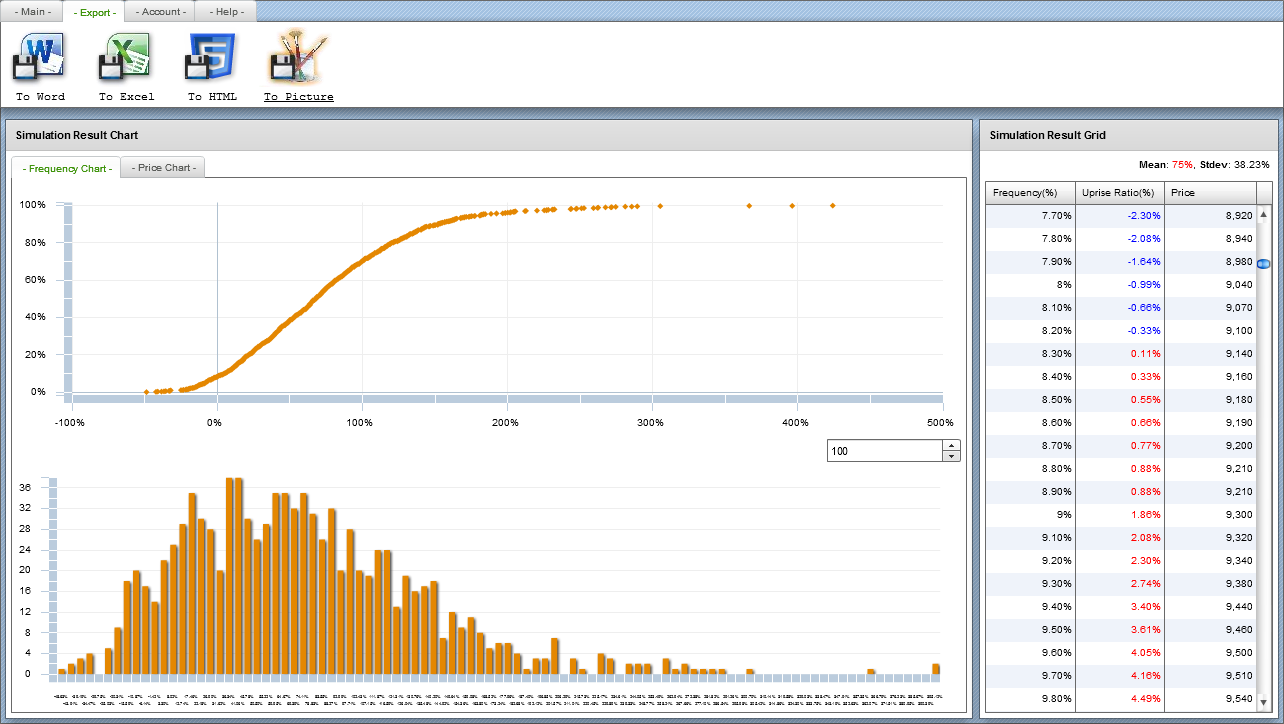
Displays a distribution of return by normal and cumulative graph.
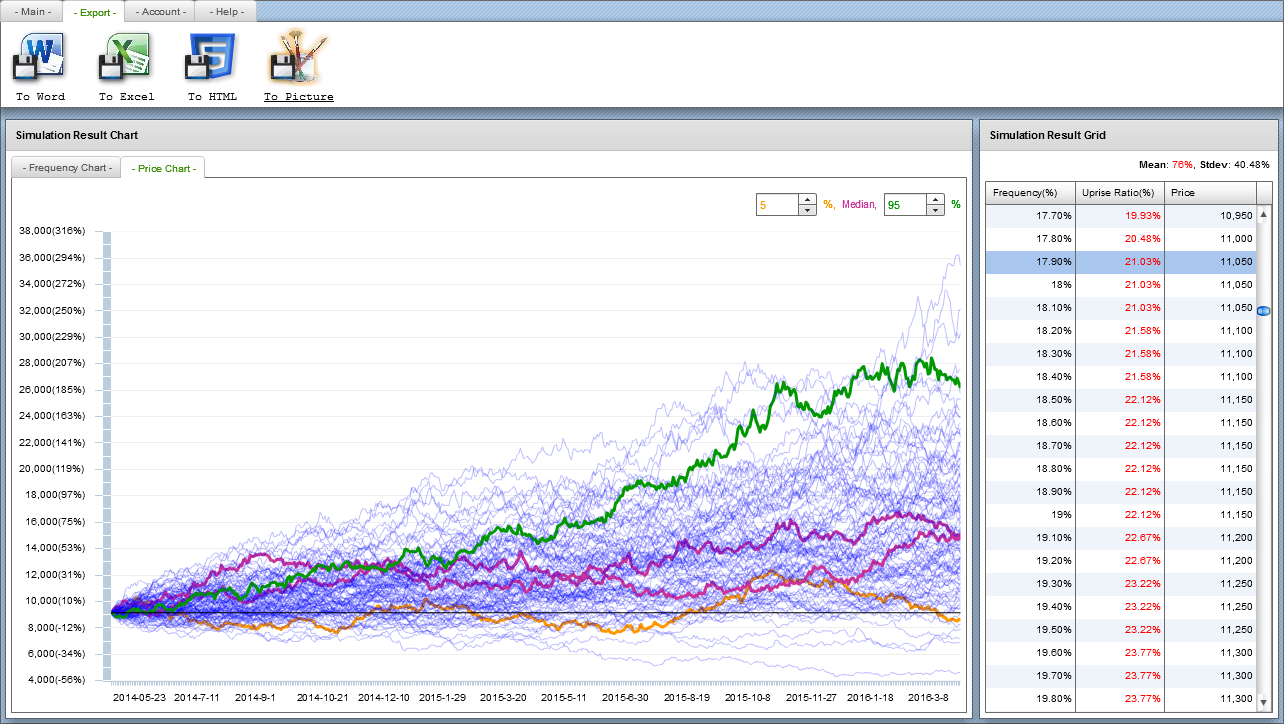
Display all graphs for each simulated price.
But as the reason of performance and validation, only 100 maximum simulations are be displayed.

Top menu in all page has a component "Export".
From inquiring corporate data to simulation result, you can save and export them to word, excel or html document. You also can capture a screenshot to png file.
Of course, as you could save your configurations, you can open and save the simulation configurations whenever you want.