Roos Verkade - rvdegroen/notes GitHub Wiki
Table of Contents
- Who is Roos Verkade?
- About NOSop3
- What is an interactive?
- How do people look at you visalization?
- What do you want to communicate
- Interactive complexity
- Visualization
- How do they Work at NPOp3?
- Cliché and Summary
Who is Roos Verkade?
Roos Verkade is software developer from NOSop3. NOSop3 is a broadcasting organisation which has an special statutory obligation to make news programs. She is here to talk about her project flitser.
About NOSop3
They are an orginastion for the youth and they make news that is easy to understand for those who watch or listen to them. They have a podcast and they are on instagram.
What is an interactive?
It is to explain the news to people in an easy way with some interaction from the user.
How do people look at you visalization?
She said several interesting things such as:
Think about:
- How to get someone's attention within 8 seconds
- Who is your audience
- What do you want to communicate
What do you want to communicate
Think about what your central question is going to be and keep this small, because then you can easily focus on what you want to communicate. If it's a big thing, then cut it into chunks. Start small, because it's easier to add things than to remove things.
If you know what the central question is: what do I want to communicte? Then you know how to display this visualization.
Roos Verkade projects central questions
- Flitser - How do you keep up a flitser company because they have more loss
- Schiphol - How long are the rows
- Internjet - What sees a russian on their smartphone
- James Webb = How deep do we zoom into with the James Webb telescope?
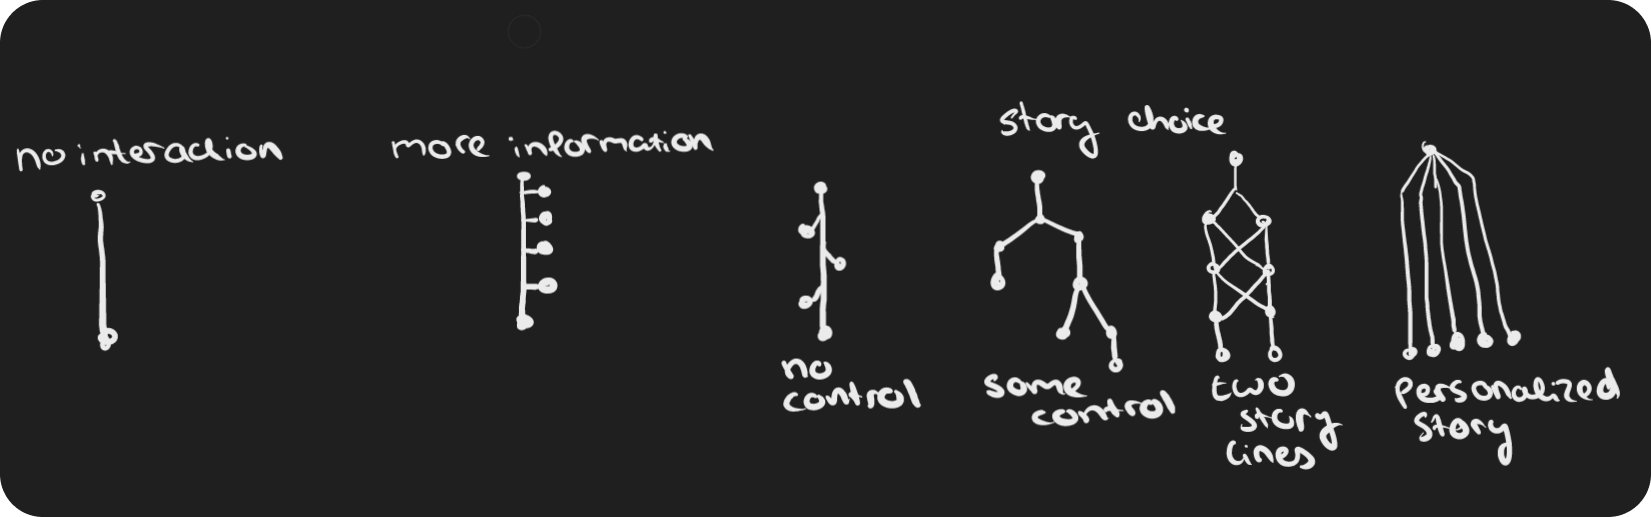
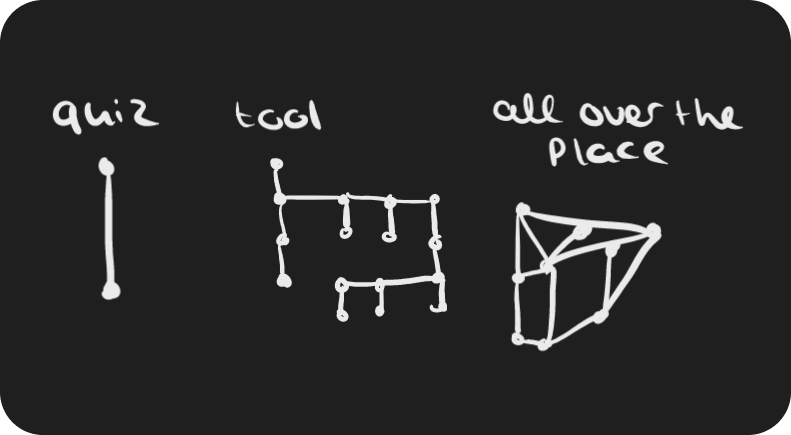
Interactive complexity
There are different form of interactive complexity.
Once you know what you want to communicate, you know how you would want to user to interact with your data and you know what interaction to use. Not all interaction forms are fit for every story you would want to communicate.
Visualization
After you know what kind of interactivity you want, you know what visualization to show. You can use bar charts, graphs, pie charts etc.
Flitser project visualization
Flitser is an interactive about flitser delivery. The most important thing about flitser is that they show at the end of the website what the company loses in money to you in a receipt form
The interactive has a form of a little bit of choice, but still has the same outcome or end.
James Webb
This interactive is to see how far star signs are in the sky. It has an interactive complexity of more info. So this interactiveness was pretty straightforward.
Schiphol
Just like James Webb it had an interactive complexity that contained more information (so it had some deepening). This project it was shown how the ratio was between staff at schiphol and passengers.
Minister Filter
This project is a tool. This was when new ministers were chosen. They communicated who these people are, what they do and how do I get to know them? They used a few filters so that you as user can choose what you want to know about these people.
Internjet
This project had an interactivity of "choose your own adventure". It was more story than data. It showed a phone that you can click on to see what you can see on a russian phone.
How do they Work at NPOp3?
They work alot together, especially in the beginning and then talk with the team about:
- How much time do I have - 6 weeks is what they usually have
- Which data am I missing? - Do I need data, do I need to call
- Which technique are we going to use? - They have standard components they can use, they can run their project, because they need to work in an certain style, they're looking for libraries if it's possible
Cliché and Summary
To summarize the whole presentation:
- Know your audience
- "Frame" your story
- Less is more
- Think outside the box
- Function over form
- If you can dream it, you can build it
Source: https://en.wikipedia.org/wiki/Nederlandse_Omroep_Stichting
Reflection
I liked the whole presentation. It was really easy to follow along with all of her points. The example projects she used really added to understanding certain things in her presentation, such as the complexity of each interaction within a project. I also liked the way she presented. Overall a very good and enjoyable presentation in my opinion.