Benchmark Results: Userspace qemu - ruijiefang/llvm-hcs GitHub Wiki
Summary for this week
This week I finally made qemu work with clang instrumentation via a small hack: https://github.com/ruijiefang/llvm-hcs/wiki/Collecting-instrumentation-information-from-qemu-in-userspace-emulation. I also found a way to benchmark qemu wholesystem emulation with an Ubuntu image: https://github.com/ruijiefang/llvm-hcs/wiki/Benchmarking-qemu's-whole-system-emulation. This weekend, I measured icache misses in baseline qemu versus qemu with HCS with the Ubuntu OS startup process selected as the workload; the results are here: https://github.com/ruijiefang/llvm-hcs/wiki/icache-misses-for-qemu-wholesystem-benchmark. In addition, the scripts for performing this benchmark is collected at https://github.com/ruijiefang/llvm-hcs/tree/arcpatch-D57265/gsoc-ruijief. The decision to try do a system-wide qemu emulation benchmark is because system-wide qemu binaries have a larger size: https://github.com/ruijiefang/llvm-hcs/wiki/Production-qemu-binary-size.
After gathering profiling data, I recompiled qemu with PGO and with hotcoldsplitting enabled. For HCS-enabled compilation, I created a modified version of LLVM to facilitate printing out HCS-related statistics: https://github.com/ruijiefang/llvm-hcs/tree/arcpatch-D57265. I merged Vendant Kumar's D57265 patch (which added hotcoldsplit as cc1 option and scheduled HCS into -O2/-O3 passes), and added a bit of code into HotColdSplitting.cpp, CFGPrinter.h, CFGPrinter.cpp. The changes are as follows:
- I added two variables to the class
DotFuncInfothat tells us if a BB is marked in HCS as cold or has been extracted. - I changed the node attributes when printing out DOT CFGs: for BBs identified as cold, they are outlined in red; for BBs identified as extracted, they are outlined in red and filled with yellow color. Note that these are BBs within the original function; the newly created cold function isn't printed out since we're primarily interested in how HCS identifies cold blocks.
- I changed HotColdSplitting pass to first print out all identified cold/extracted blocks, and then extract them.
The code is very messy, but it suffices for our experiment's sake ;)
HCS-enabled run:
       3179.306525      task-clock (msec)         #    0.962 CPUs utilized
             5,397      context-switches          #    0.002 M/sec
               229      cpu-migrations            #    0.072 K/sec
             9,531      page-faults               #    0.003 M/sec
     2,816,788,590      cycles                    #    0.886 GHz
     1,763,543,757      instructions              #    0.63  insn per cycle
       355,066,639      branches                  #  111.681 M/sec
        11,215,947      branch-misses             #    3.16% of all branches
       512,650,759      L1-dcache-loads           #  161.246 M/sec
        60,876,348      L1-dcache-load-misses     #   11.87% of all L1-dcache hits
         6,765,903      LLC-loads                 #    2.128 M/sec
           856,056      LLC-load-misses           #   12.65% of all LL-cache hits

       3.304043591 seconds time elapsed
Baseline:
       3272.444345      task-clock (msec)         #    0.972 CPUs utilized
             5,618      context-switches          #    0.002 M/sec
               298      cpu-migrations            #    0.091 K/sec
             9,720      page-faults               #    0.003 M/sec
     2,893,104,749      cycles                    #    0.884 GHz
     1,807,229,561      instructions              #    0.62  insn per cycle
       365,296,352      branches                  #  111.628 M/sec
        11,520,090      branch-misses             #    3.15% of all branches
       531,652,543      L1-dcache-loads           #  162.463 M/sec
        62,132,367      L1-dcache-load-misses     #   11.69% of all L1-dcache hits
         6,952,609      LLC-loads                 #    2.125 M/sec
           877,260      LLC-load-misses           #   12.62% of all LL-cache hits

       3.367710560 seconds time elapsed
x86_64 Whole System Emulation: Ubuntu 18.04 Startup+Shutdown Time
Plot

HCS Mean: 3.62 Seconds
Baseline Mean: 3.22 Seconds
Analysis: qemu startup involves a lot of syscalls, most of which is directly translated in a tight loop via a switch statement to native system calls. Hence the benefits of HCS is not immediately obvious. We might consider running some network/IO intensive applications on the target OS and look at the results again. Alternatively, the rather short startup time is because we configured crontab to call shutdown immediately after crontab gets started by systemd. We can adjust the startup level of crontab to defer running crontab until after everything else has started up, and then shut down the system (instead of shutting down the system once crontab starts).
What about userspace qemu?
Invoking clang to compile postgresql via qemu-x86_64
Indeed; we can see that the benchmark time for using userspace qemu running x86_64 LLVM to compile postgresql (takes ~15m CPU time for baseline qemu) differs:
non-PGO -O2 baseline build:
We averaged the result from 3 trial runs, each.
mean: 14 min 40.3s (real) 53 min 47.5s (user)
PGO-enabled build:
mean: 12m 23.28s (real) 45m 39.76s (user)
PG+HCS build, delta threshold=-5
mean: 12m 25s (real) 45m 25s (real)
PGO+HCS build:, delta threshold=0
mean: 12m 29.95s (real) 46m 4.717s (user)
Running autotools ./configure via userspace qemu for postgresql
We averaged the result from 3 trial runs, each. Baseline qemu: 2m20s
HCS-enabled qemu: 2m38s
The differences are small, since ./configure involves only clang runs of small C programs and a lot of other commands, which contribute to the noise.
Other statistics
Utilizing PGO information, our HCS pass identified and tried to split 4332 regions inside qemu in total. Of the 4332 regions, we extracted 2911 regions into cold functions. The remaining regions were deemed unprofitable to split; see the log file for penalty/benefit deltas of individual regions for details: https://github.com/ruijiefang/qemu_hotcoldsplit_output/commit/023884091555f1809920f579b618c229aefe539f#diff-cb27c004cbf0f2086c4349d87441420e.
Exploring the regions
I modified LLVM to dump functions with identified cold blocks and explicitly outline cold/splitted blocks. For detailed graphics, see below:
HCS Output: See https://github.com/ruijiefang/qemu_hotcoldsplit_output. Each image represents a function that contains a cold region/cold blocks. The splitted blocks are outlined in red and painted in yellow; the cold but not splitted (basically when HCS decides not to split based on the cost model) are outlined in red and painted in white.
For example:
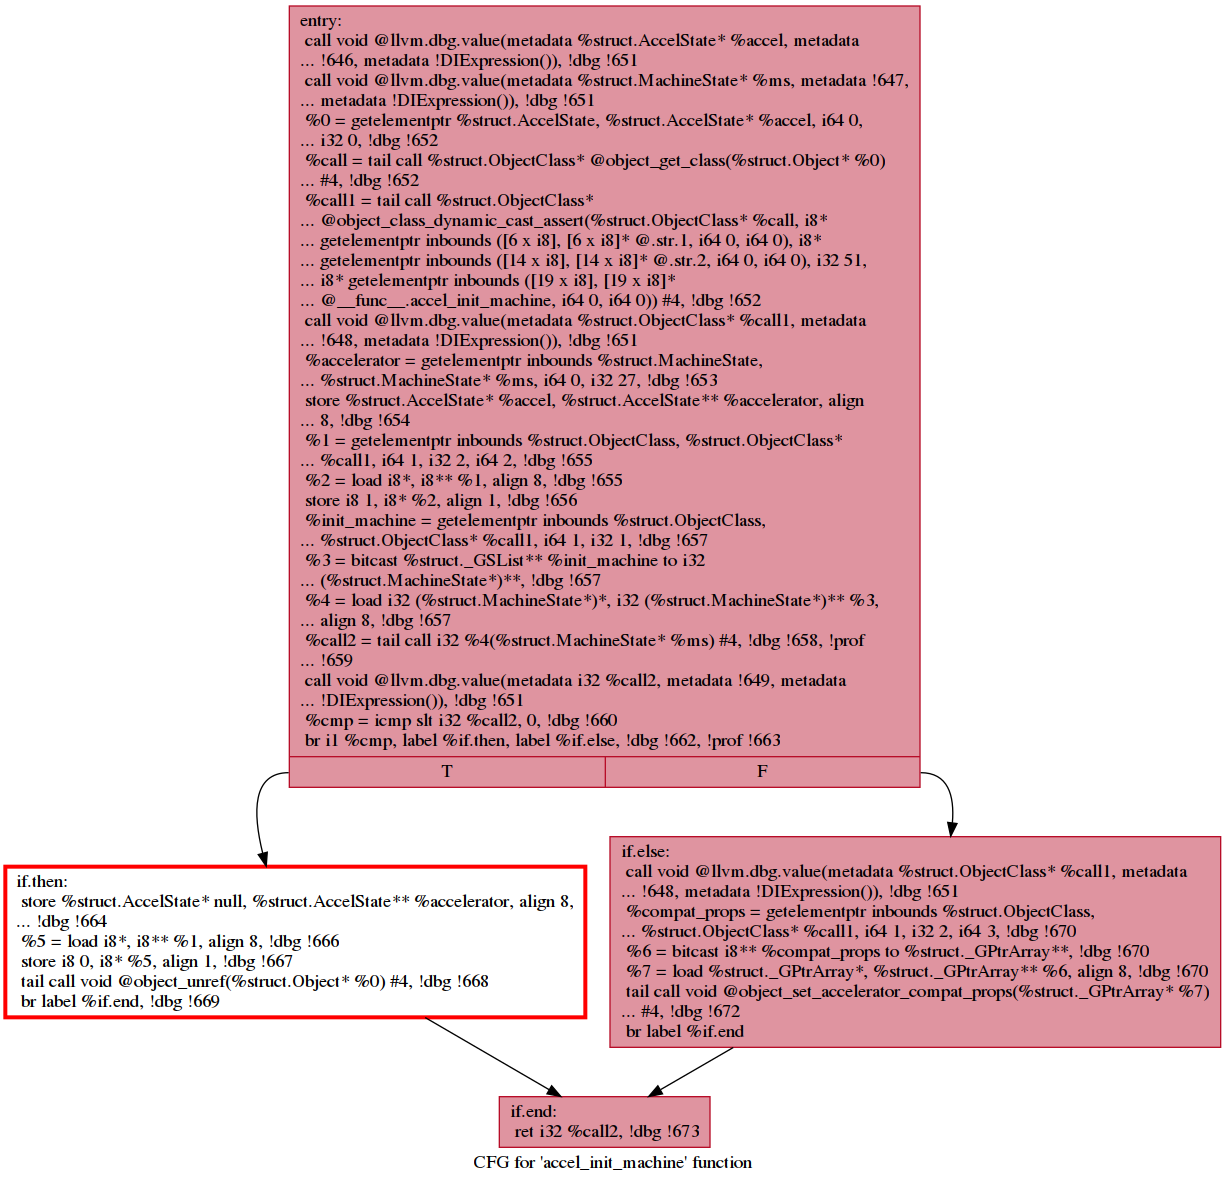 This function contains an if.then block that has not been extracted.
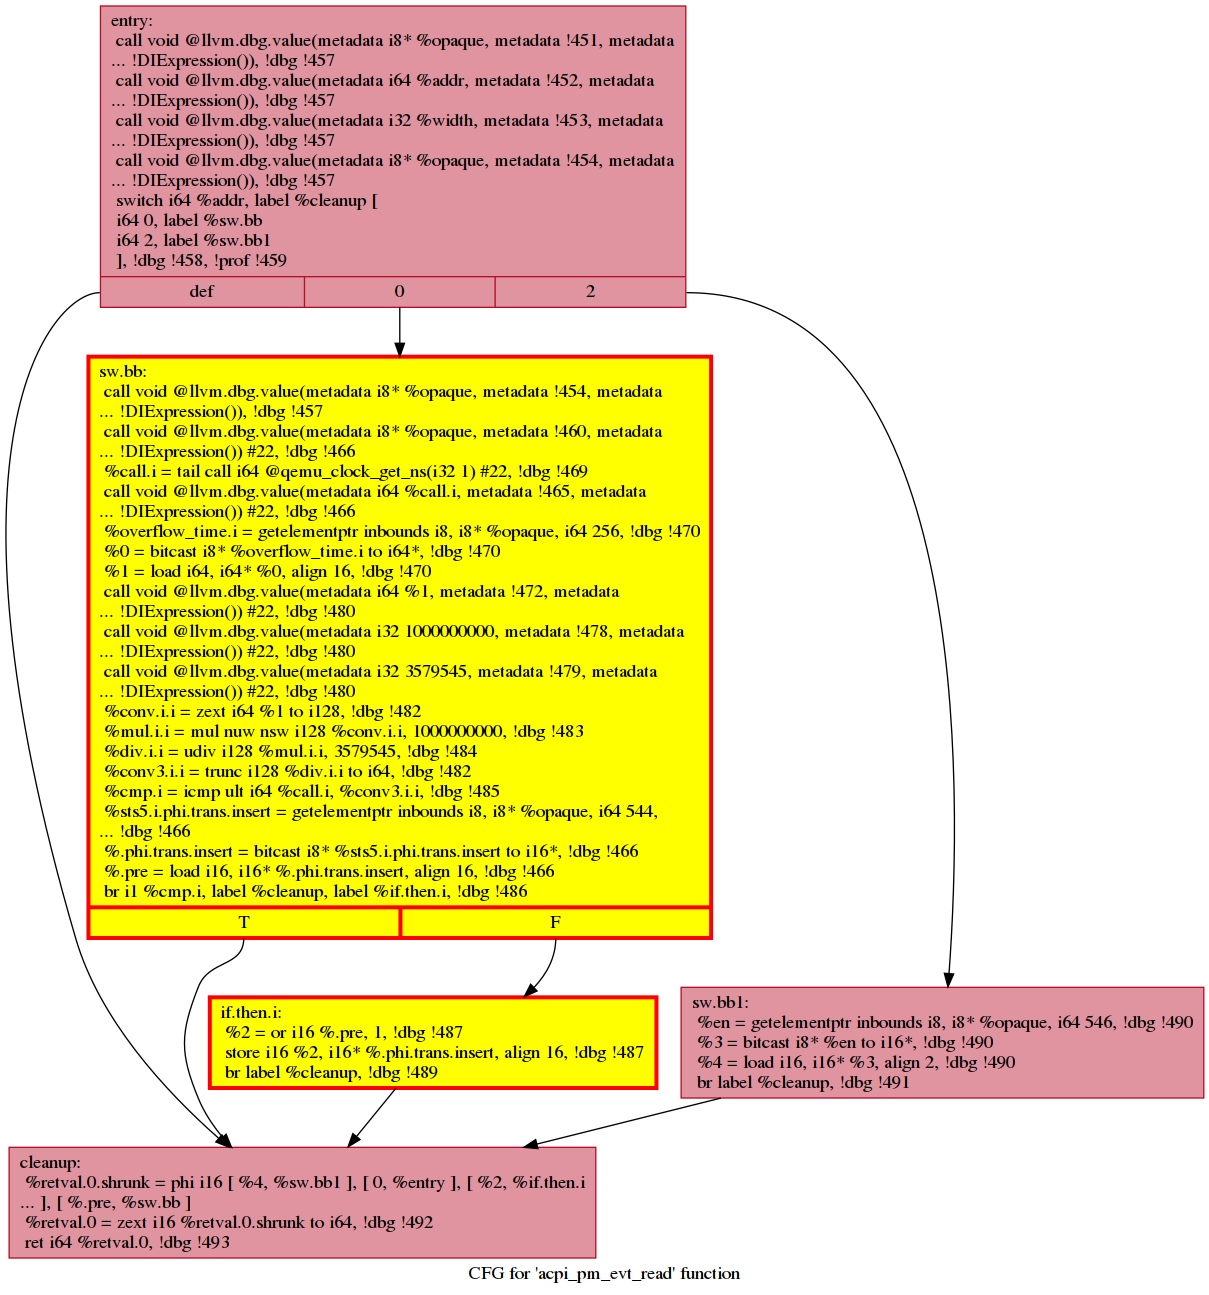 In this function, we see that the entire region has been extracted into a new function.
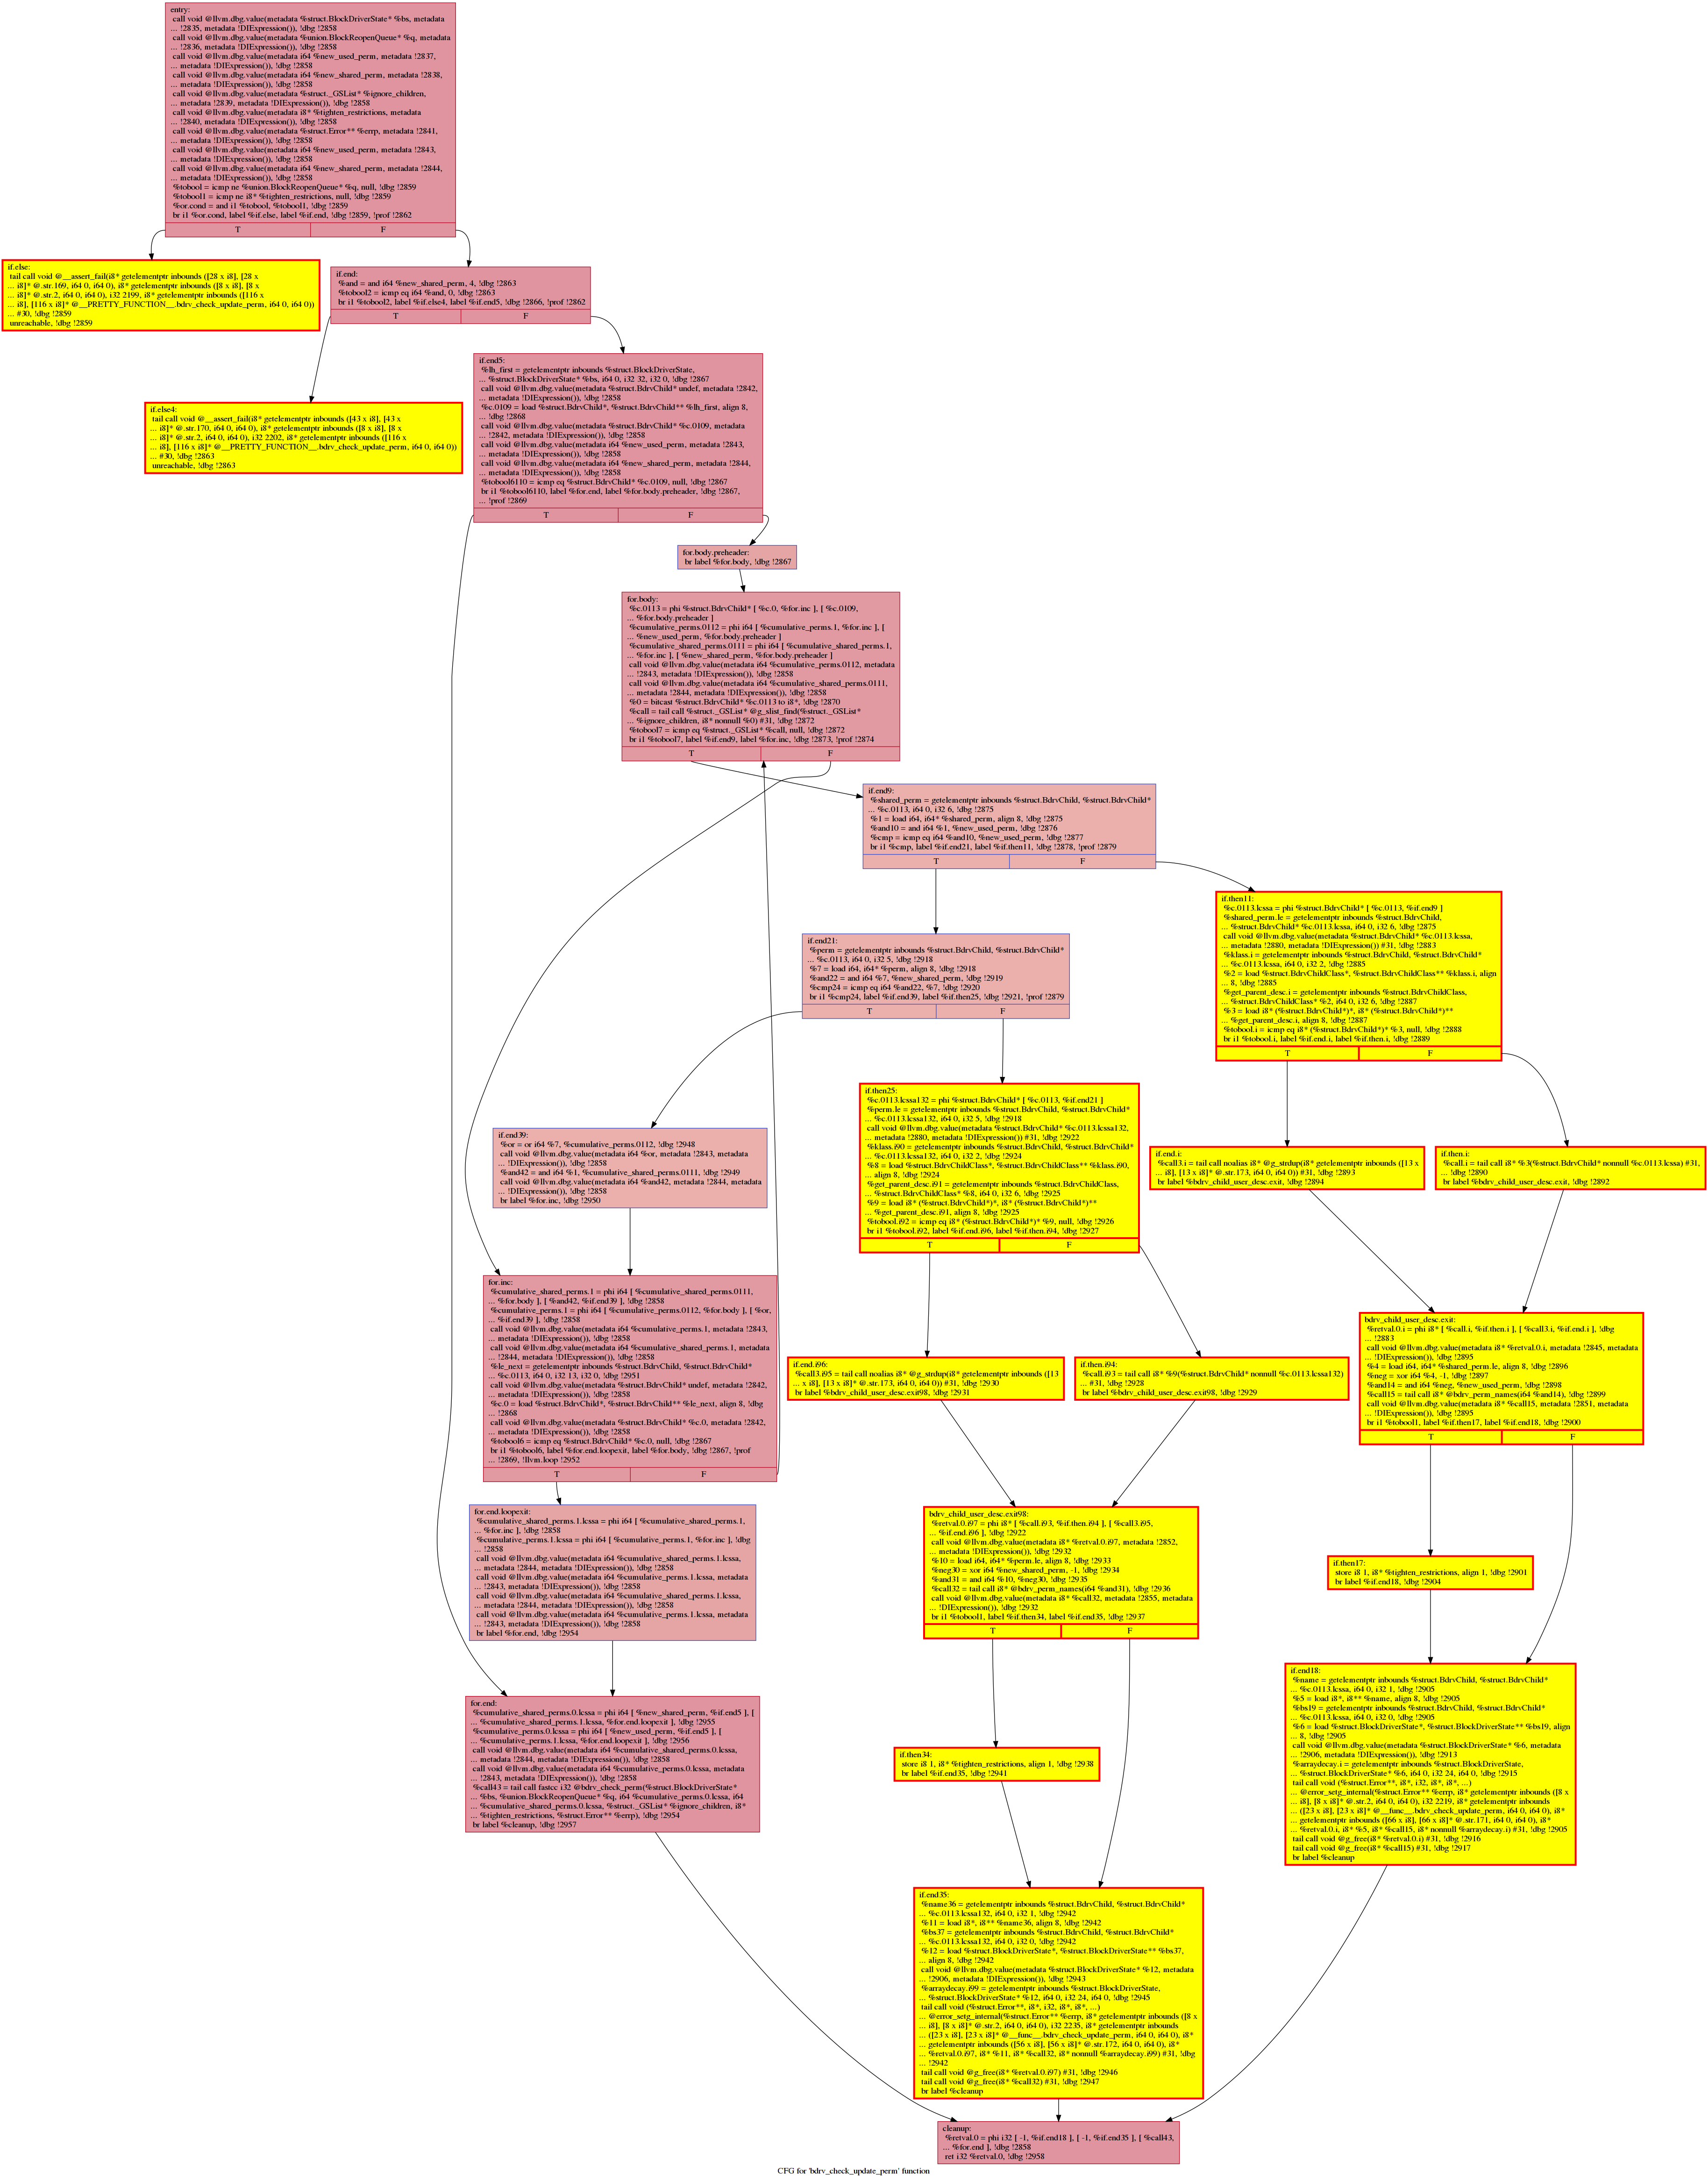
 This function contains both cold code that has been extracted (see the region with entry block if.then.i) and that has been deemed unecessary to extract by the cost model (see if.then5).
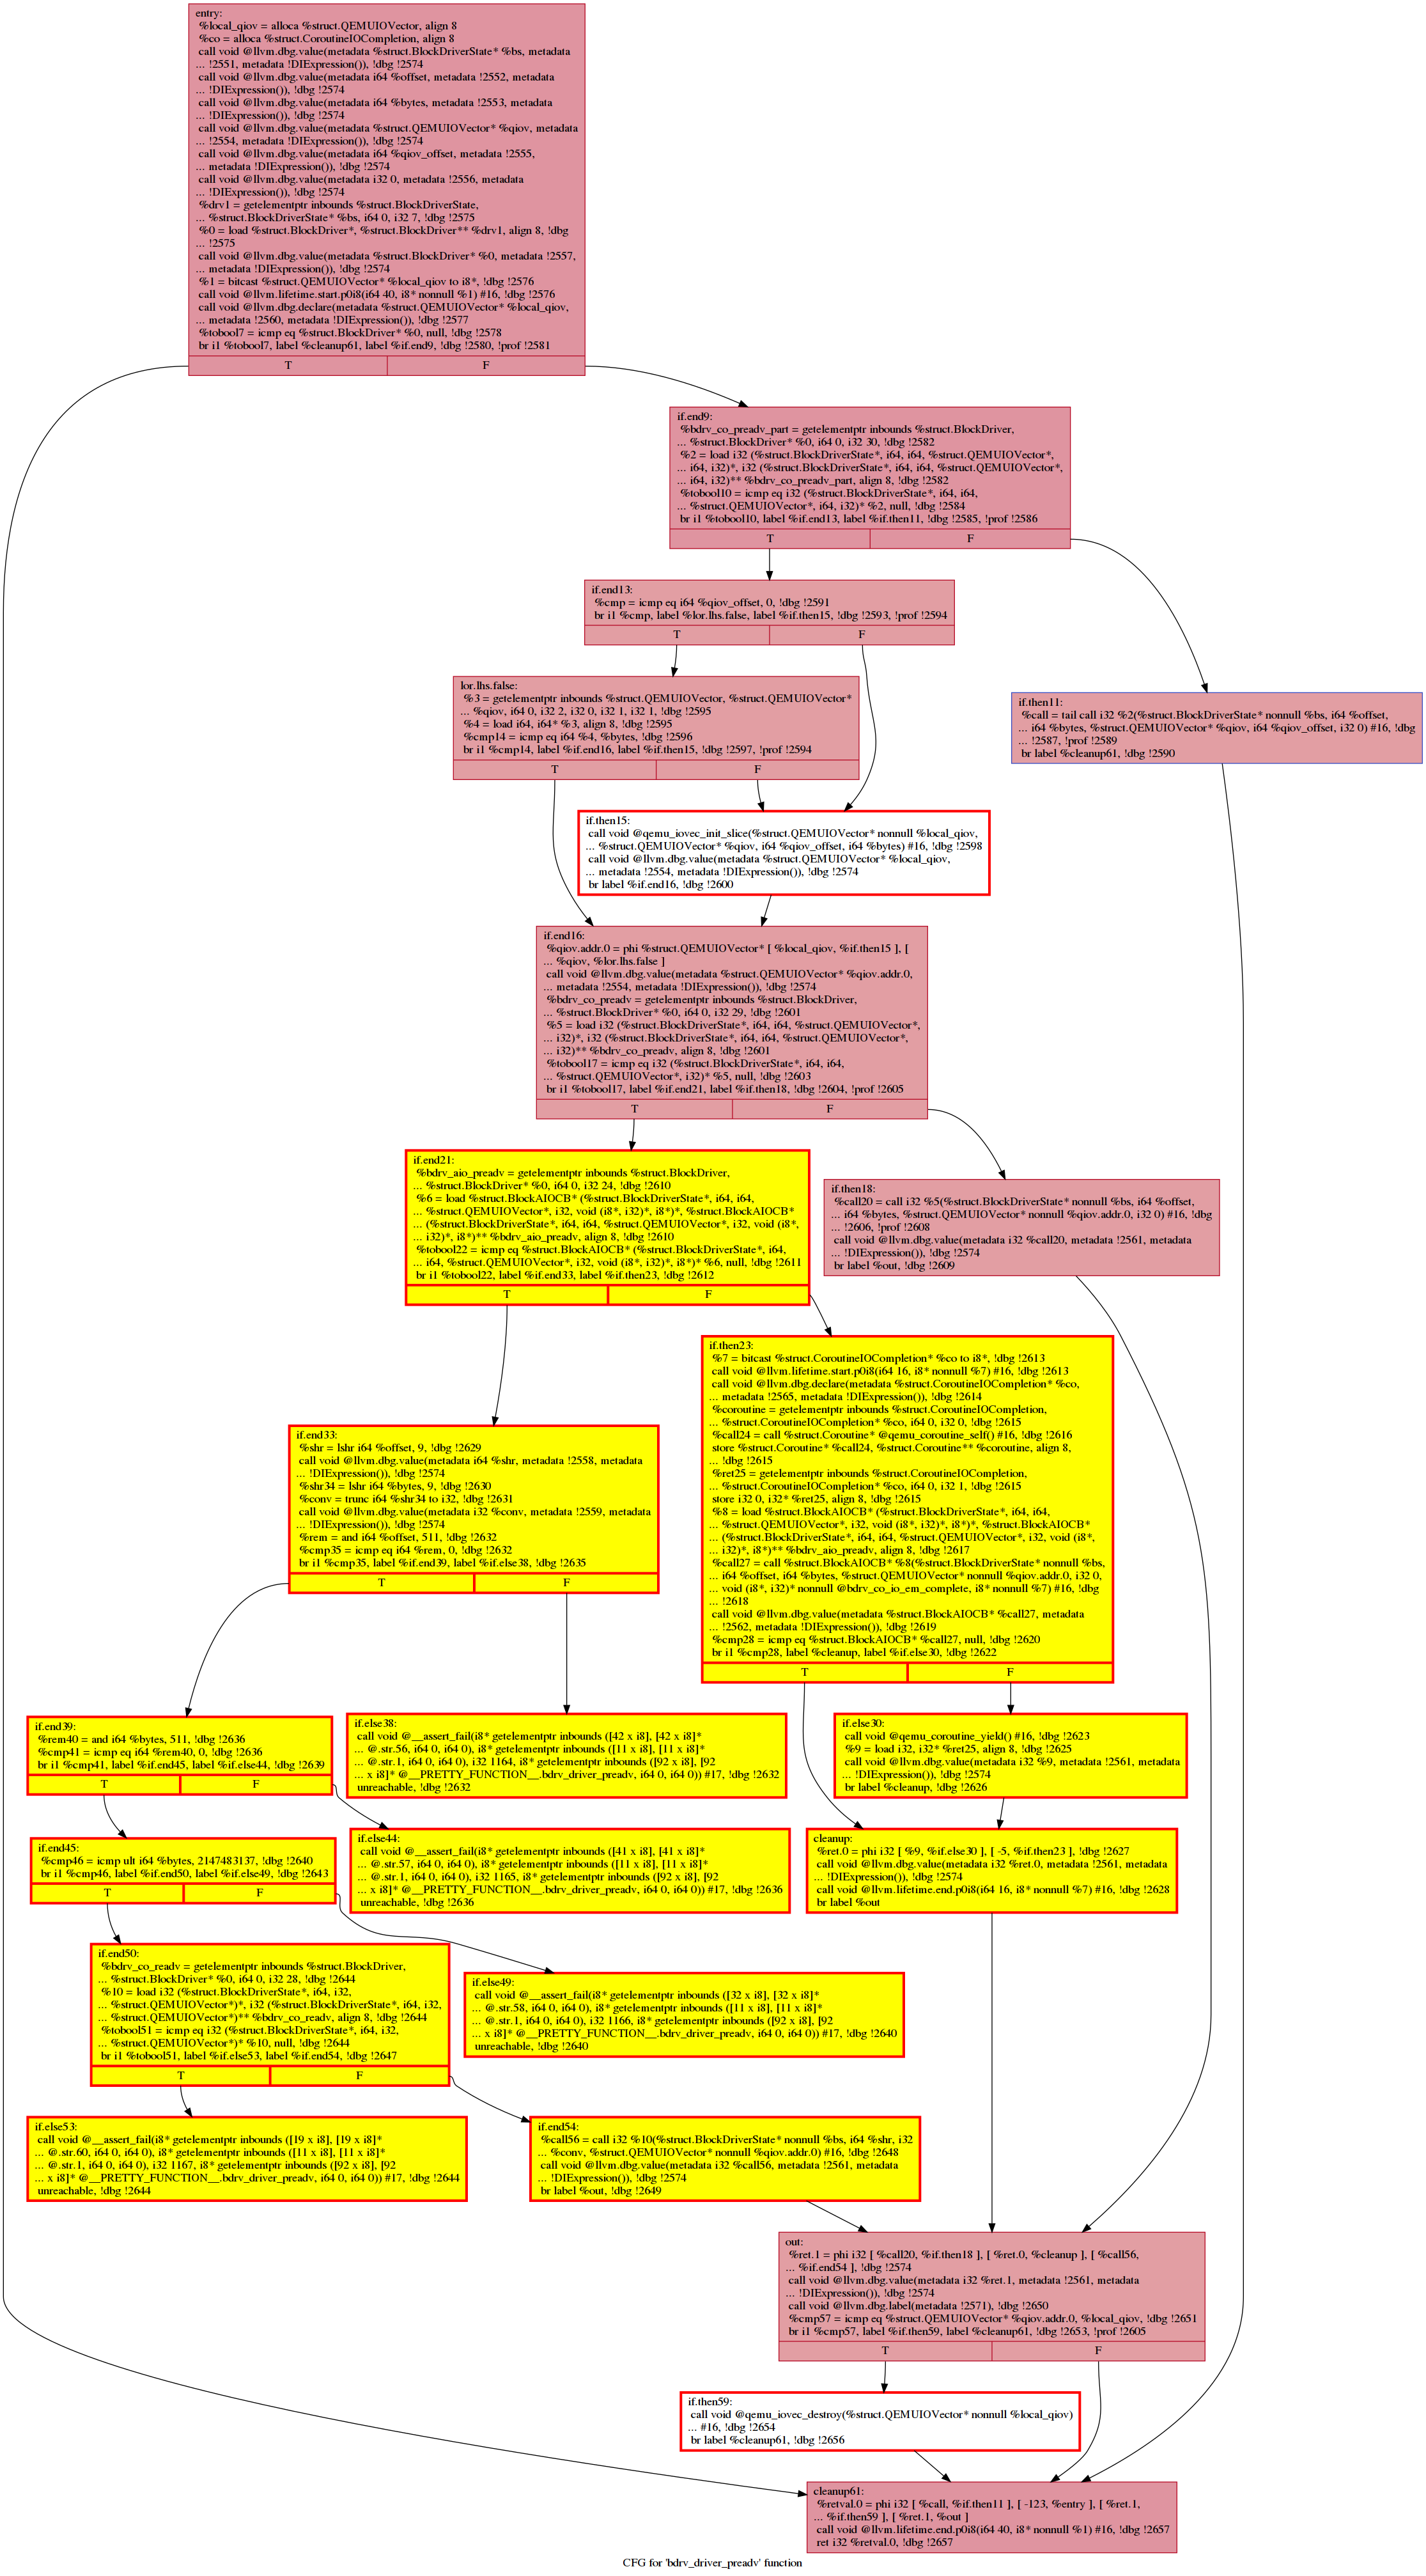 This function contains two small blocks that have not been extracted (if.then15 and if.then59)
It is worth noting that some of the loops have been extracted into cold functions. A reasonable explanation is we haven't used some qemu emulation features: e.g. audio/video interfaces, so any sort of code that involves chores that initializes/cleans up these unused features will end up having a majority of the blocks marked as cold. There are, however, evidence that HCS works diligently to split out things like unvisited error handling blocks: