Illustrated example 2 - rrwick/Verticall GitHub Wiki
This page illustrates the Verticall pairwise process using a real pair of assemblies:
- INF357: a Klebsiella pneumoniae isolate
- KSB1_8D: a Klebsiella variicola isolate where some parts of the genome have been replaced by Klebsiella pneumoniae sequence
The second assembly (KSB1_8D) was also used in Illustrated example 1. There it was compared against a K. variicola assembly, so its horizontally-acquired K. pneumoniae content was more distant than its vertical content. This example is the opposite: it's compared against a K. pneumoniae assembly, so its horizontally-acquired K. pneumoniae content is closer than its vertical content.
While I went into lots of detail in Illustrated example 1, I'll keep things a bit briefer here and in subsequent examples.
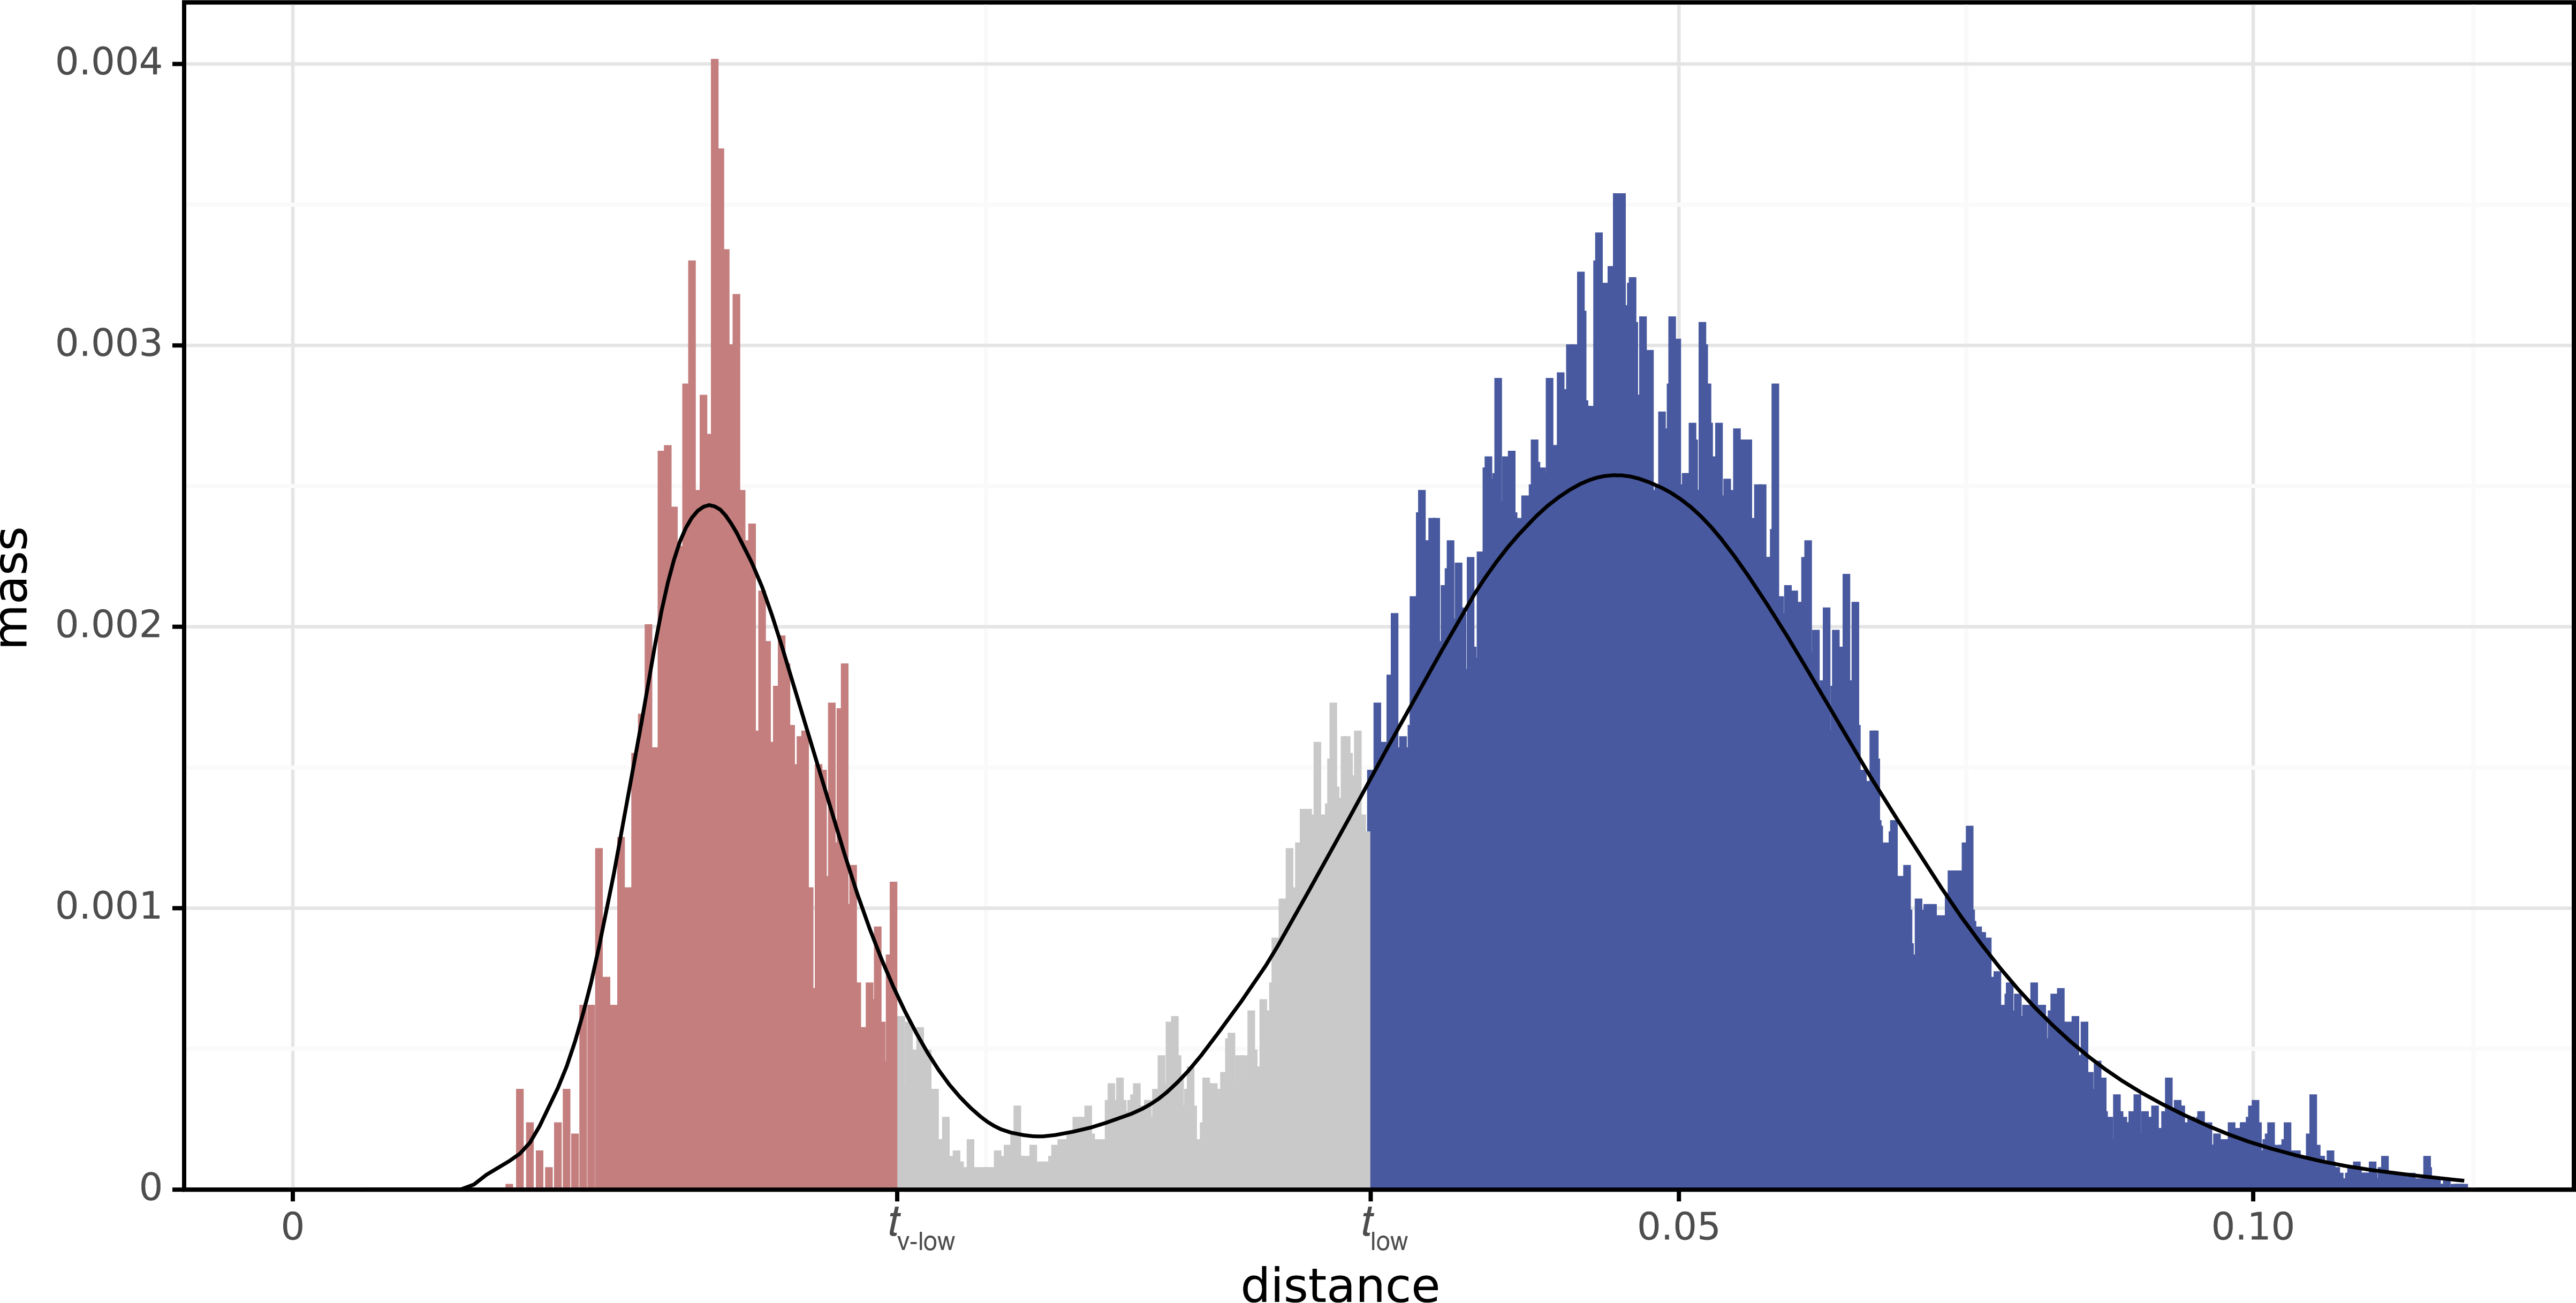
Here is the distance distribution with the smoothing and partitioning shown:

Since this distribution doesn't have a local maximum to the right of the main peak, there are no thigh and tv-high thresholds. This means Verticall isn't considering anything to be horizontal because too much divergence in this pair.
Also note the square-root transform on the x-axis. So while the right peak looks roughly twice as massive as the left peak, it's actually more than seven times as massive, because its bars are more densely packed.

Here is INF357, the first assembly:

And here is KSB1_8D, the second assembly:

The mean distance between these two isolates (using the entirety of their alignments) is 0.04674. This is similar to the value you'd get using Mash (distance=0.04472) or FastANI (identity=95.275%, distance=0.04725).
However, that distance includes the horizontally-acquired regions, so if we want the vertical distance (i.e. the distance using only the vertically-inherited parts of the genome), it will be too low. Verticall's mean vertical distance only uses the vertically-painted parts of the alignments and gives a higher distance of 0.05182.