GOODPUT - rohithsaji/TCP-BBRv1 GitHub Wiki
Results
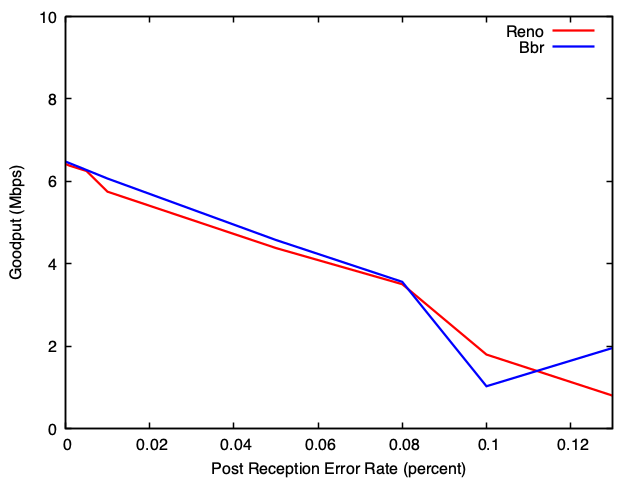
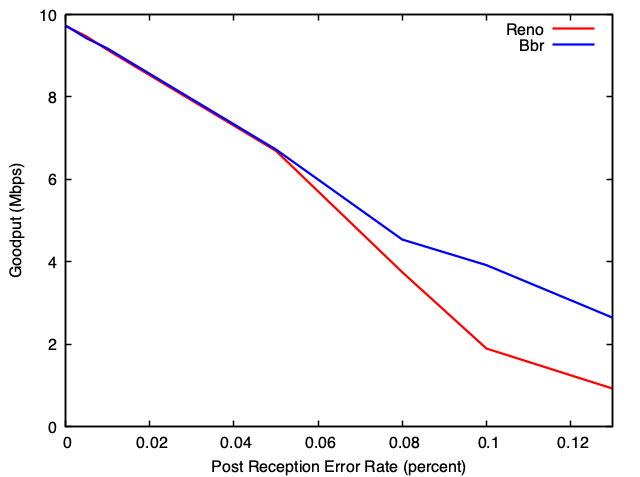
We compare the goodput TCPBBr with TCPNewReno. The following PostReceptionErrorModel error rates have been used(Percent):
- 0.0001
- 0.001
- 0.005
- 0.01
- 0.08
- 0.1
- 0.13
Note:
- The error rate in the graphs below do not indicate the total packet loss in the bottleneck link, but only the error induced in the PostReceptionErrorModel. Actual packet loss value was observed to be significantly higher, but this method should help us determine how BBr would perform against New Reno in a lossy wireless network.
- Different simulations were done for each error rate.
- The simulations last for 10sec.
- Average goodput value is noted with the error rate, and plotted with Gnuplot.
Configuration 1:
- Data Rate(Wired links):100
- Delay (Wired link):5
- Data Rate(Wireless link):24
Configuration 2:
- Data Rate(Wired links):100
- Delay (Wired link):5
- Data Rate(Wireless link):12
Conclusion
There is no significant improvement in TCPBBr from TCPNewReno when the bottleneck data rate is low. But, increasing the bottle neck data rate shows TCPBBr performing better than TCPNewReno in lossy wireless network.
Commands
- Use this command to run with TCPBbr with 0.001 error rate
./waf --run "scratch/tcpbbr-goodput --error=0.001"
- Use this command to run TCPNewReno with 0.001 error rate
./waf --run "scratch/tcpbbr-goodput --error=0.001 --tcpTypeId=TcpNewReno"
- Use this command to run plotscripts
gnuplot <name of plot script file>
- After running tcpbbr-goodput trace files can be found in the goodput-results folder.
- All plotscripts and results can be found in the Results folder.