Design Rationale - robert-hoekstra/strvct-students GitHub Wiki
Prologue
Welcome to the Design Rationale of STRVCT, a web application made by students. Supported by WallScope.
Linked Data is getting popular
 And it has been here for decades. Linked data is getting more and more popular among businesses. But why? Linked Data can be very complex and scary at first. But if you get to know the full potential of Linked Data, you'll see that Linked Data holds a tremendous amount of knowledge about organisations and businesses.
Linked Data has always been here for a while. However it is one of the forgotten technologies within the World Wide Web. It is still a vague sandboxing project for most developers. Visualising Linked Data is still something that is considered experimental and therefore a standard for displaying such data is not yet been made.
The Problem: Visualising Linked Data
 WallScope is a company based in Edinburgh. They work a lot with (linked) data. Their main goal is to create a structured vocabulary out of files, documents and all kinds of stuff that holds information. When it comes to knowledge within an organisation. One will surely stumble-upon different kinds of information connected to each other. In other words: Data is related to each other in different ways.
Structuring the data into a structured vocabulary is not a problem anymore for WallScope. It is still time consuming however. And displaying the data is also a problem on it's own. Thus the developers of WallScope came with a concept that would relieve them from endlessly writing vocabularies. But also a tool that would help WallScope and their clients to understand their own Linked Data in a better way.
Design Challenge
Considering the complexity of Linked Data that should be easy to understand and manage we came with the following challenge:
How do we create a web application that makes Linked Data manageable and easy to understand? To solve this question we started to think in subquestions.
What is Linked Data
- What is a RDF Schema
- How is Linked Data Created
- How is Linked Data Structured
How is the user going to manage Linked Data
- How can the user add, edit or even delete Linked Data
How do you visualise Linked Data (JSON-lD)
- What tools are out there to visualise JSON-LD
- What are the best ways to visualise complex (large) datasets
How do we maintain performance when working with large data
- What tools can we implement to audit performance
- What can we do to improve performance
Progress
Points of Improvement
Elastic search to segment the data even more. For the sake of performance and overview. Creating an environment in which the user created its own TTL file.
Design Decision: After a coaching talk with Laurens. Laurens told us that creating, manipulating structured vocabularies and visualising that data are two complete different complex concepts. Therefore Laurens advised us to narrow the scope to visualising the data. So we discussed that latter with WallScope and WallScope agreed. WallScope also indicated that their problem that needs to be solved is mainly the visualising part. As they struggle with big datasets becoming too complex for the user to understand.
Accomplishments
We managed to understand what Linked Data is and how it can be created and used. WallScope supported us with a public API in which we could send requests to. The API provided us with an array of objects. Constructed out of a .ttl file that is uploaded to the API. So we could focus more on the visualising part of the product. Rather than the CRUD functionality of the product.
A more in depth explanation of our design and product can be read in the following part of the Design Rationale
Design Decision: At first it was our primary goal to structure the JSON-LD in a way that it became hierarchical of itself. A lot of concepts might share the same concept as a broader 'parent'. And it can also be the other way around of course. We managed to structure the data in a way that we could implement it in our Front-end section of the application.
What is Linked Data
Linked Data is a way of storing data in a set. Linked data contains all kinds of objects. Those objects are called concepts. Concepts contain several properties like: URI, note, broader concept, related concepts etc.
Why do we use Linked Data
Linked Data becomes interesting when multiple computers within an infrastructure can share and read their collective linked data. That way computers can add and query data from different locations for different purposes. Thus creating a very rich and valuable infrastructure of information.
RDF
The Resource Description Framework is a framework that started in 1999. It is a semantic web standard to give meta-descriptions to objects that need to fit the linked Data structure. The meta-description of an object makes up the semantic value of it's position within the dataset. This description is also called a Triple. More about Triples in the next section.
Triple Store

What makes RDF so strong within linked data is that it is build out of triples. Those triples consist of an object, predicate and a subject. Those three values tell the computer how the object is related to the subject. An object can be a parent, sibling or child concept of the subject. Thus if A is parent of B. B is child of A. This kind of logic makes linked data so powerful.
How is the user going to manage Linked Data
Because WallScope offered us some ways to work with data we could focus more on the visualising part of the data. Thus at first we added a check if there is already data uploaded. If so, the data will get rendered into a visualisation. However, if there is no data present we want to give the user the ability to upload the data. Data needs to be uploaded in a .ttl syntax
Design Decision: For the duration of the project we focussed on complete datasets and visuals. Thus some functionality like creating, editing, and deleting complete or nodes from the dataset has been left aside. We are working on it within the last week of the project.
How to visualise Linked Data
Visualising Linked Data is a pretty complex problem. Because one has to determine how to display the data. There has to be some kind of structure that is more easy to oversee. We ended up by recursively check if concepts share the same parent concept. Then we nest those concepts in the parent concept. Thus creating a hierarchy consisting of 1 parent node splitting up in multiple children that in their turn can be parents as well.
One of the main problems WallScope experienced with their clients is that the client does not fully understand or use the product/visualisation how it was meant to be used. Therefore WallScope concluded that there probably is something off with the design.
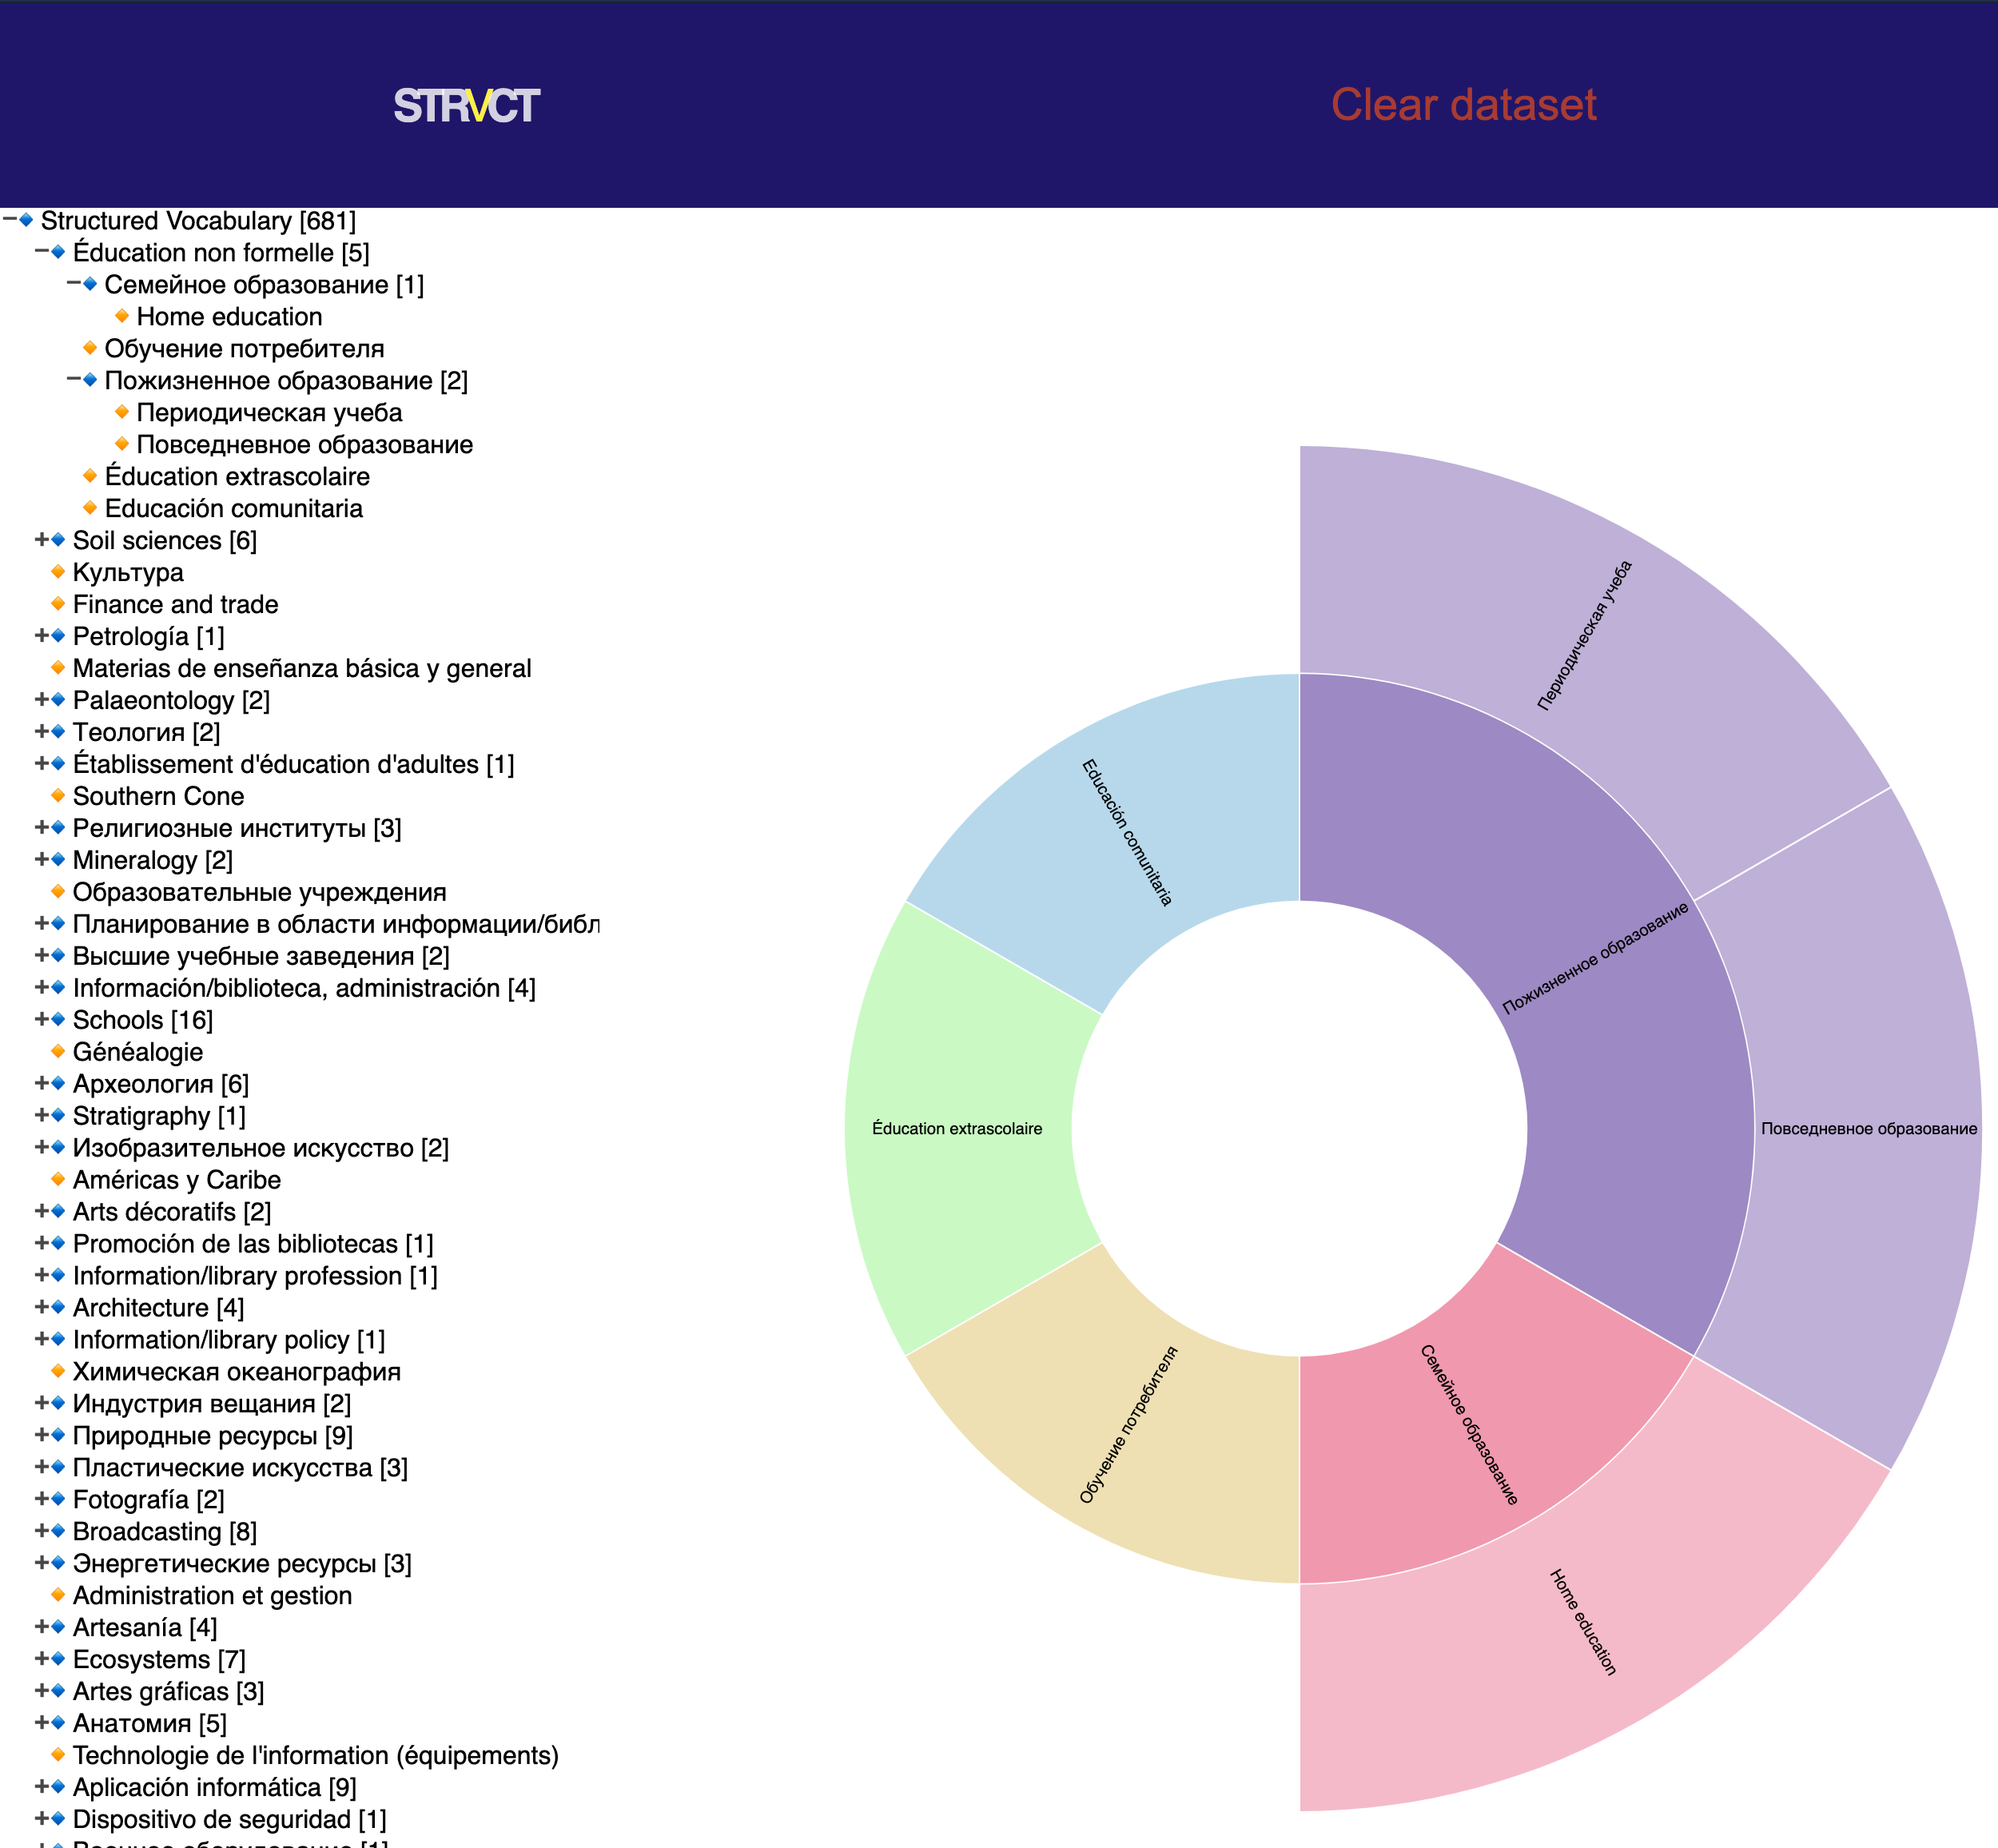
Design Decision: We decided to start with exploring different kinds of visuals that are possible on the front-end of the application. We ended up with a lot of showcase demo's that were available from the D3.js package. We continued to work on different visuals and ended up with this concept of where the user gets to see the complete dataset in a file tree structure. Combined with a graph like a sunburst. We designed an interactive application that responds to graph and file-tree input.
D3
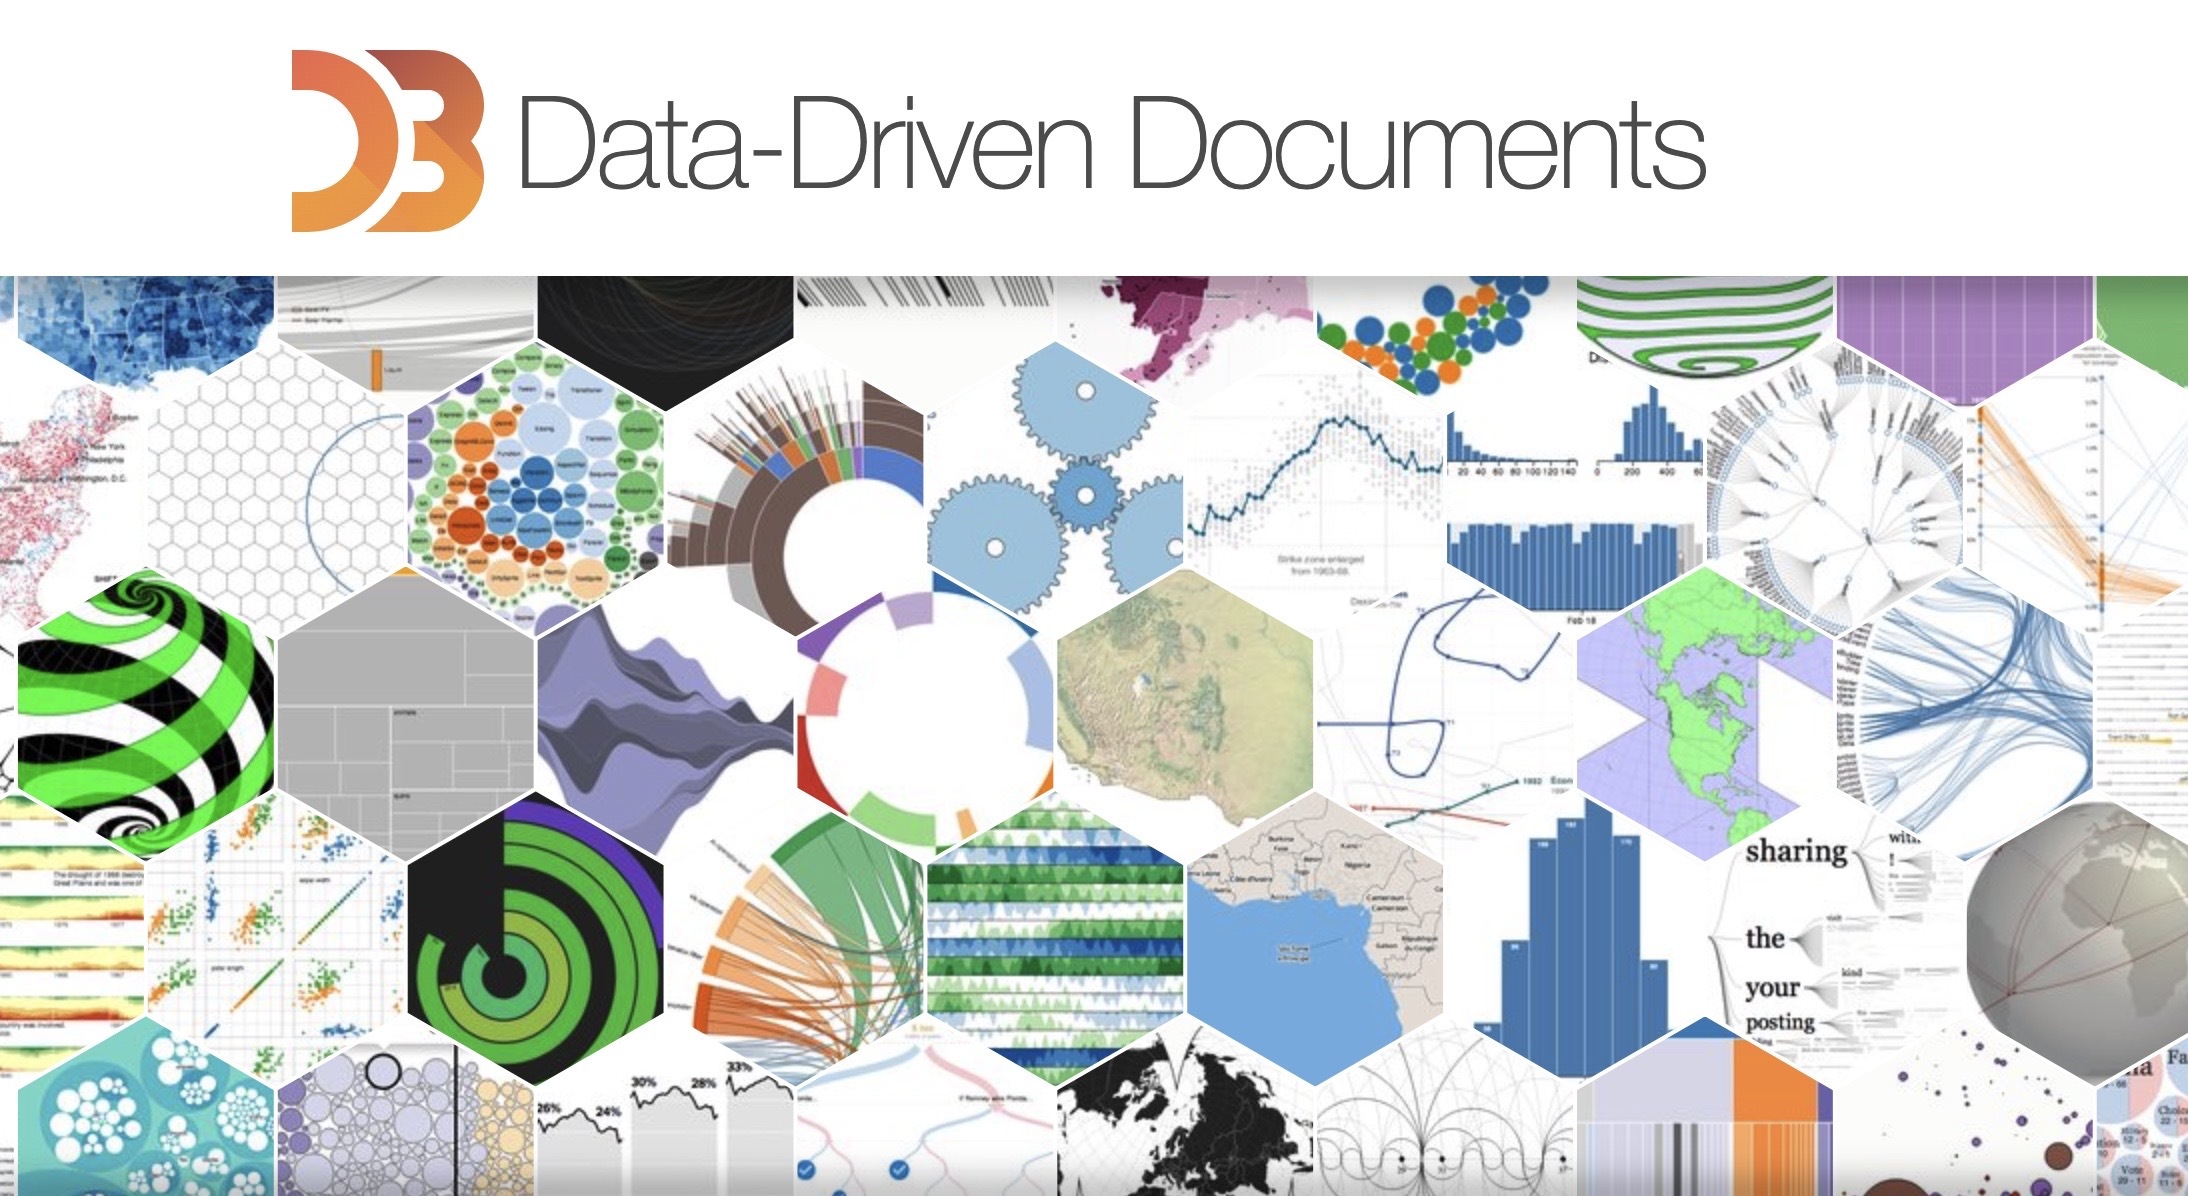 This is one of the biggest data visualisation packages out there. We wanted to use D3 because we mainly would work with data that needs to be presented to the user. Rather than creating or editing data at the backend.
With D3 it is possible to create different kinds of graphs, run multiple iterations on data and control the interaction flow of the user.
It is mandatory for the user to support JavaScript in the browser. Else it won't work.
This is one of the biggest data visualisation packages out there. We wanted to use D3 because we mainly would work with data that needs to be presented to the user. Rather than creating or editing data at the backend.
With D3 it is possible to create different kinds of graphs, run multiple iterations on data and control the interaction flow of the user.
It is mandatory for the user to support JavaScript in the browser. Else it won't work.
JSON-LD
In order to work with D3 we need to make sure the TTL file is converted to a json structured file. However the json file did not contain any kind of hierarchy, therefore we need to nest the json file into a way that the objects that have related children objects should be nested as such.
This form of JSON is called JSON-LD, short for JSON Linked Data. Basically it is an Array with objects that have nested objects inside of them.
Design Decision: As far as D3 goes. There are some options like d3.nest that could help us with structuring the data. However we choose for an approach in which we construct and clear the data in our own way. Thus keeping most of the control/overview on our side. Rather than depending on a package.
The Prototype
 The prototype is a testing product we designed that brings solutions to the needs created by the subquestions we stated before. After doing a lot of research and experimenting with the data and visuals we started concepting / designing an interface that would be easy to use and self explanatory. Also WallScope stated some requirements for us that should be met in the prototype. Thus we were scoped to an interface where the user has:
- CRUD
- Visuals of Linked Data
- Clear understanding of the data
- Options to change visuals
STRVCT
Thus we began creating STRVCT. A name we stole from its original creator: Johnny. STRVCT will eventually be a product where clients of WallScope can create their own structured vocabulary right from scratch. While working on their vocabulary they will get instant feedback through visuals like the tree, sunburst, packed circles and force graphs.
Uploading Data
The user can upload data to the database of WallScope by uploading a new .ttl file. By doing so the store gets cleared first prior to saving the newly uploaded dataset. After that process the data is safely stored. We can then continue to visualising the data.
Design Decision: However online storing of the data was not sufficient for us performance wise. We wanted to improve the overall performance of the application by checking if the user has the data already locally stored somewhere. That way the application does not need to fetch the complete dataset first or over and over again. Because of this we added a Mongo database to the application. Which we use to add timestamps to when the data was created/uploaded. It also serves as a check for the client if the data is the same or not.
Visualising Data
The main part of our job was to visualise the data that was uploaded to the api. We worked on multiple designs. One of those that really was helpful was the structured filetree. We believe it is one of the most common and understandable ways of representing data in an hierarchy.
However we wanted to add something cool. Something of value. Something that would really add a new experience to exploring data. We already discovered that putting the complete dataset into a graph like a sunburst breaks down your whole computer. But besides that, it makes it unexplorable.
We also add the ability to change the graphs. Thus giving other visuals of the data that might clarify any inconveniences experienced within the sunburst graph.
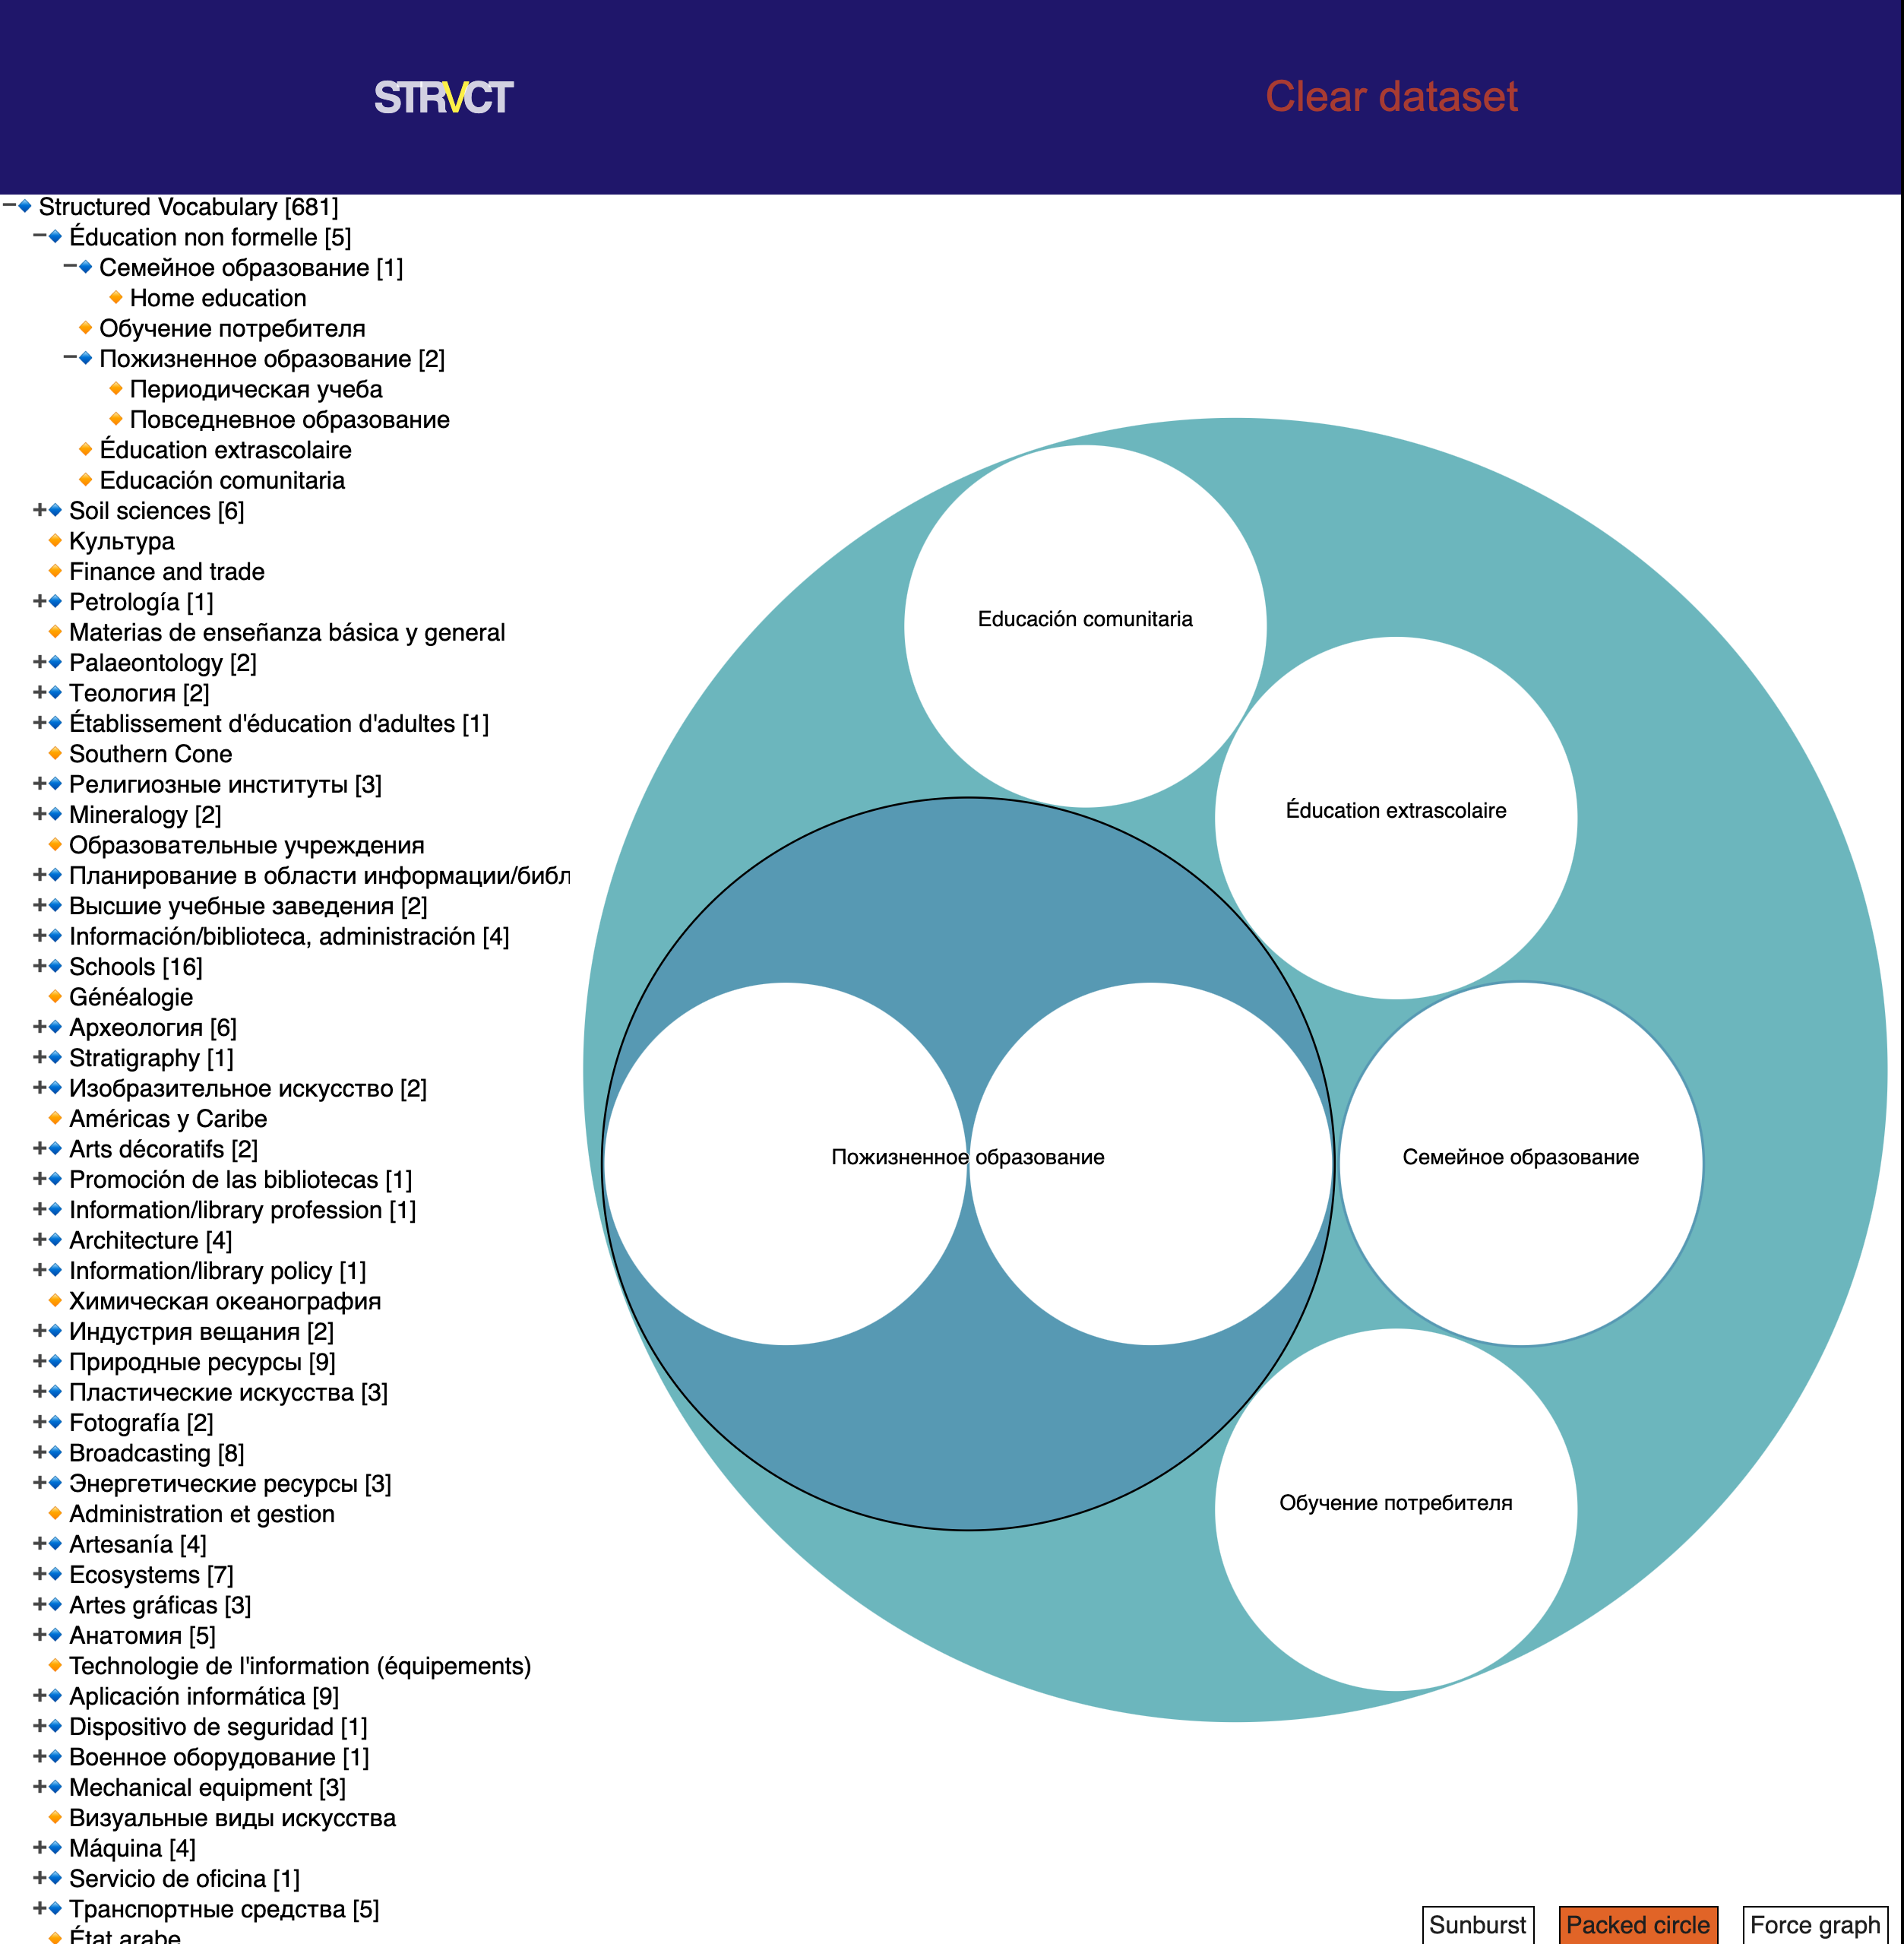
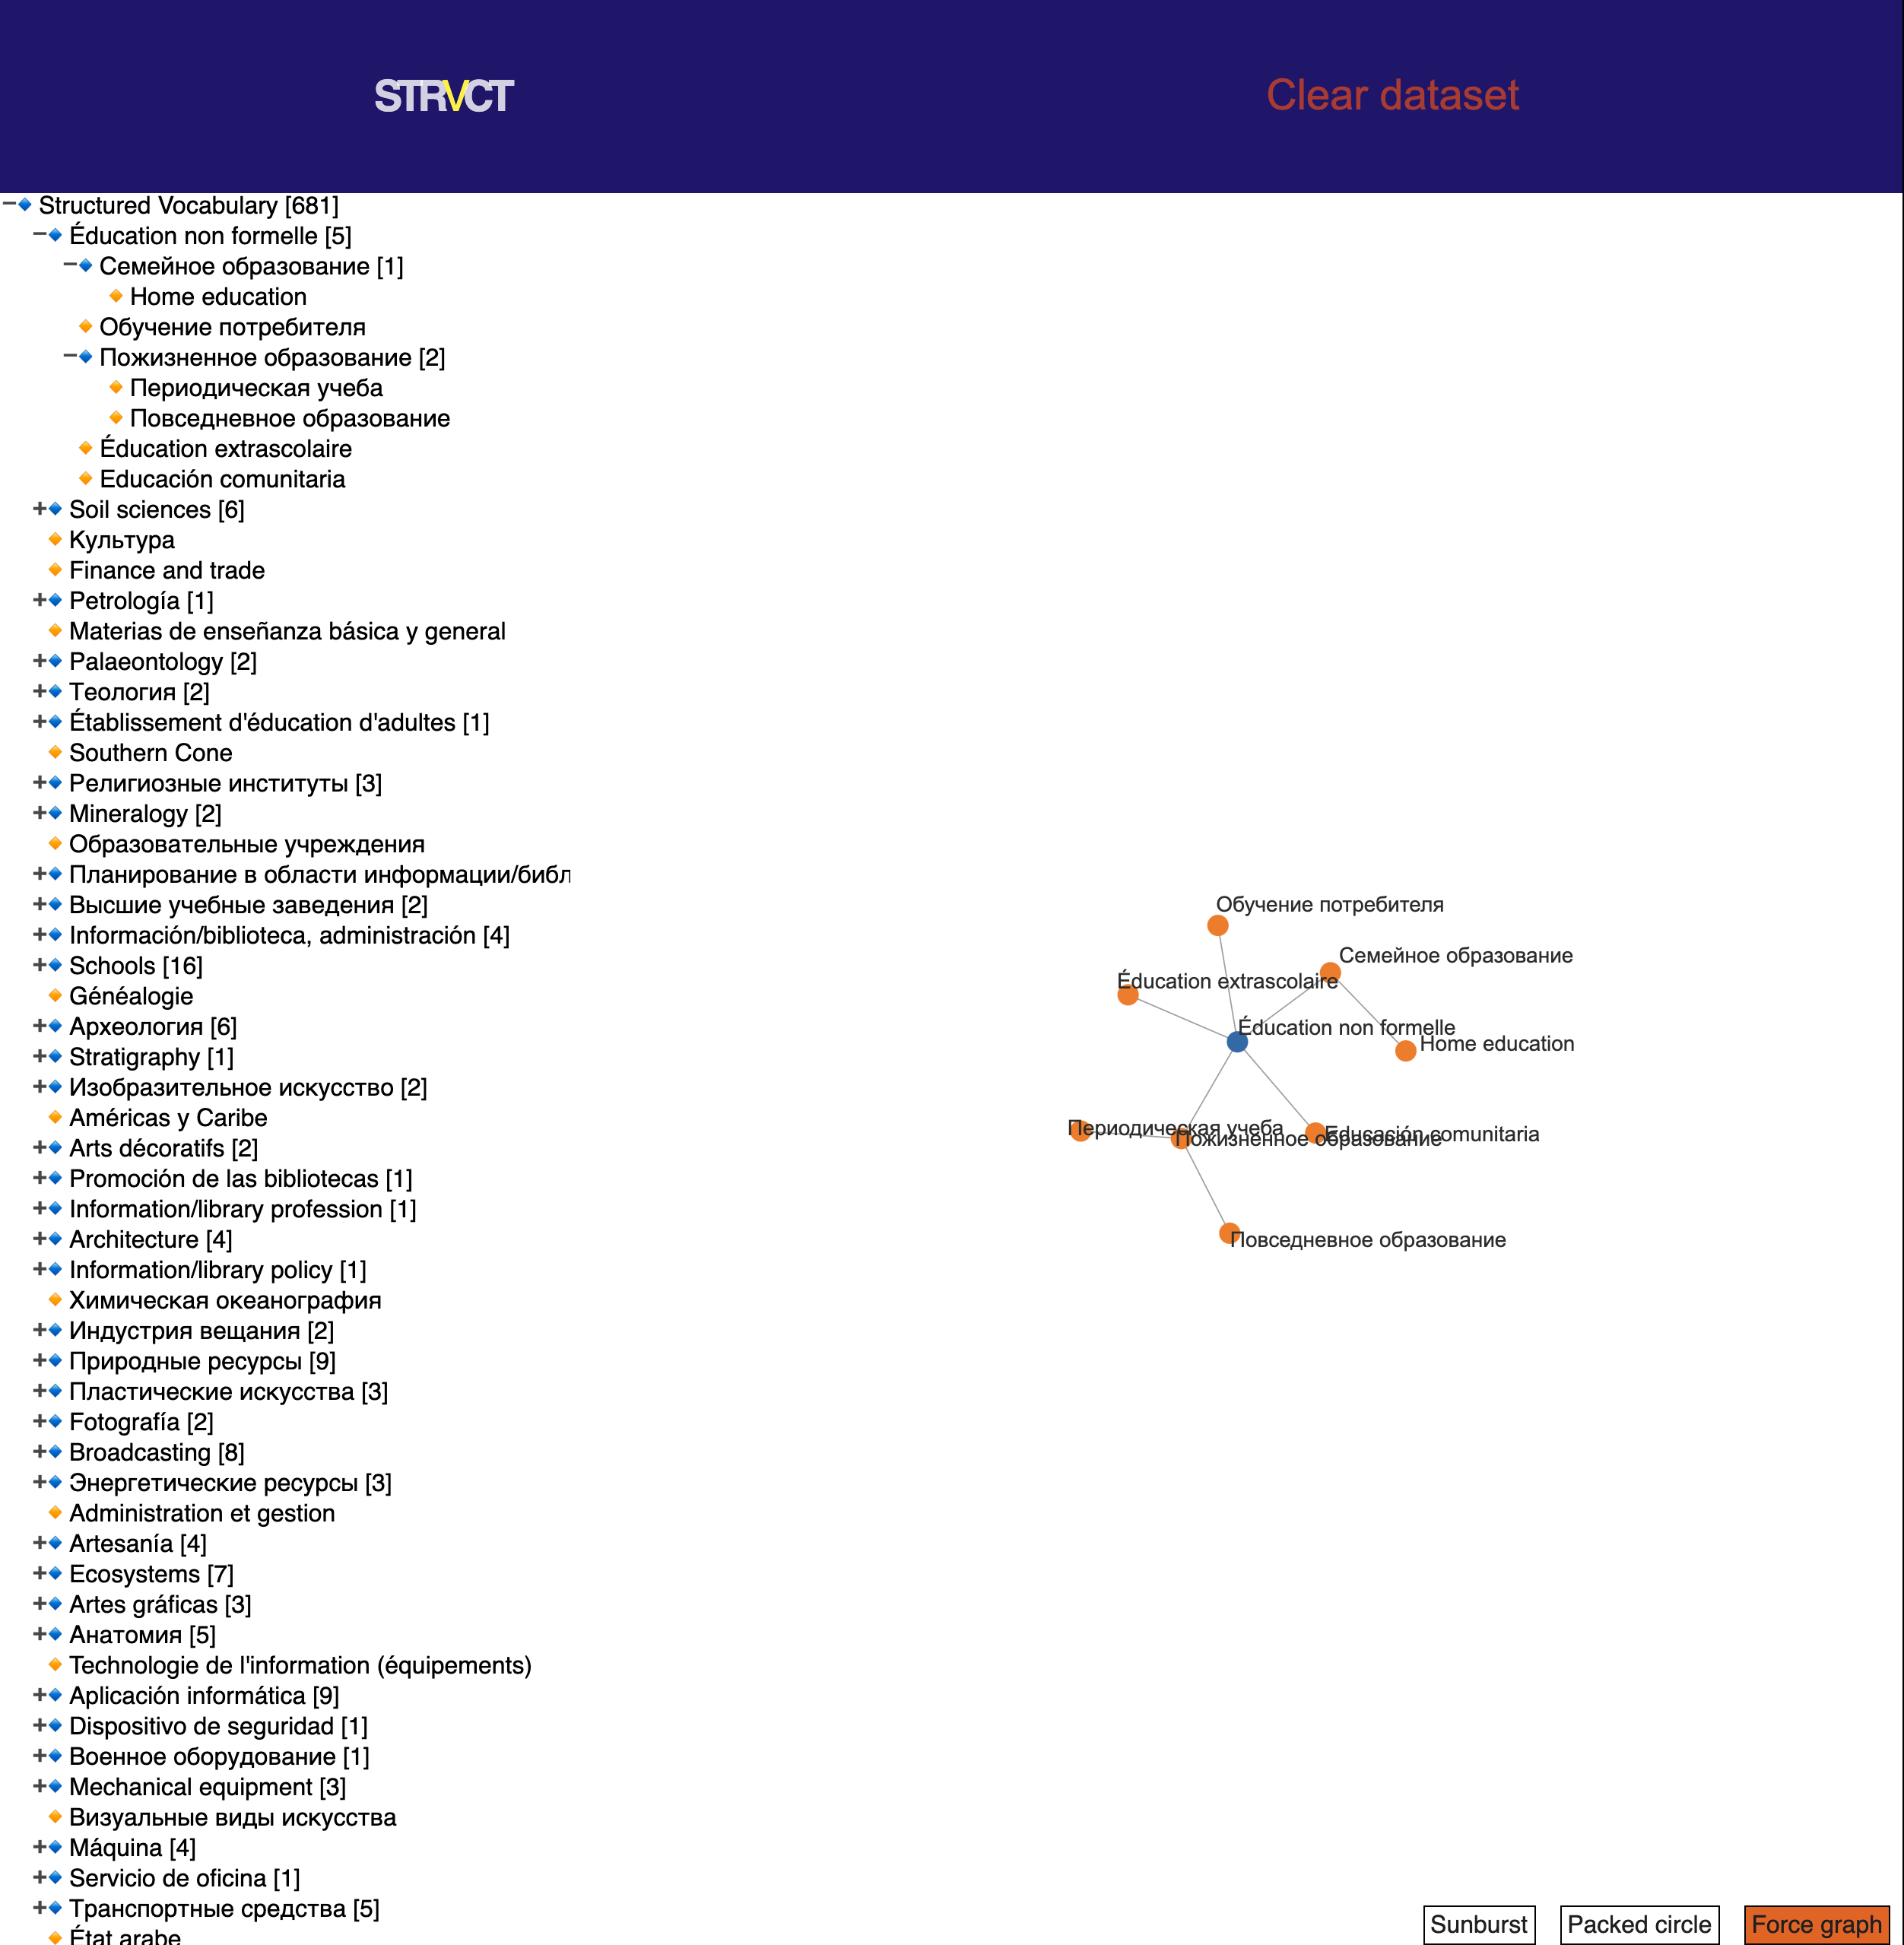
Design Decision: At this moment we created a new way of using the sunburst graph. When a user enters the application he or she will only see a top to bottom hierarchy of the dataset. When the user selects a node from this list. We will generate a sunburst graph next to it. A sunburst that has the selected node as a parent and shows a few sublevels of children that are related to the displayed parent node. Thus we create a graph that is easy to use, explore and read. And it is also performance wise a great solution!
CRUD
In order to relieve WallScope from repetitive work like converting the most unlikely 'datasets' We wanted to add functionality to the product that let's the user create, edit, update and remove nodes from a dataset. We want the user to select a parent node and give them the option to edit that node or to add a new node. The user then has to write down the properties for the node such as a description. Because the user selects a parent node, the newly created note is instantly related to that parent and the sibling at the same level. Thus the user can easily add triples to the structured vocabulary!
How do we maintain performance when working with large data
CONTENT
What tools can we implement to audit performance
CONTENT AND DECISIONS
What can we do to improve performance
CONTENT AND DECISIONS
Design Decisions
This is a list of all the design decisions documented in this design rationale:
Design Decision: After a coaching talk with Laurens. Laurens told us that creating, manipulating structured vocabularies and visualising that data are two complete different complex concepts. Therefore Laurens advised us to narrow the scope to visualising the data. So we discussed that latter with WallScope and WallScope agreed. WallScope also indicated that their problem that needs to be solved is mainly the visualising part. As they struggle with big datasets becoming too complex for the user to understand.
Design Decision: At first it was our primary goal to structure the JSON-LD in a way that it became hierarchical of itself. A lot of concepts might share the same concept as a broader 'parent'. And it can also be the other way around of course. We managed to structure the data in a way that we could implement it in our Front-end section of the application.
Design Decision: For the duration of the project we focussed on complete datasets and visuals. Thus some functionality like creating, editing, and deleting complete or nodes from the dataset has been left aside. We are working on it within the last week of the project.
Design Decision: We decided to start with exploring different kinds of visuals that are possible on the front-end of the application. We ended up with a lot of showcase demo's that were available from the D3.js package. We continued to work on different visuals and ended up with this concept of where the user gets to see the complete dataset in a file tree structure. Combined with a graph like a sunburst. We designed an interactive application that responds to graph and file-tree input.
Design Decision: As far as D3 goes. There are some options like d3.nest that could help us with structuring the data. However we choose for an approach in which we construct and clear the data in our own way. Thus keeping most of the control/overview on our side. Rather than depending on a package.
Design Decision: However online storing of the data was not sufficient for us performance wise. We wanted to improve the overall performance of the application by checking if the user has the data already locally stored somewhere. That way the application does not need to fetch the complete dataset first or over and over again. Because of this we added a Mongo database to the application. Which we use to add timestamps to when the data was created/uploaded. It also serves as a check for the client if the data is the same or not.
Design Decision: At this moment we created a new way of using the sunburst graph. When a user enters the application he or she will only see a top to bottom hierarchy of the dataset. When the user selects a node from this list. We will generate a sunburst graph next to it. A sunburst that has the selected node as a parent and shows a few sublevels of children that are related to the displayed parent node. Thus we create a graph that is easy to use, explore and read. And it is also performance wise a great solution!
Conclusion
We think that we learned a lot from WallScope and their STRVCT project. The concept and thus the problem at first was hard to understand. Therefore concepting and developing kicked off a little bit later than we would've hoped. Thus we couldn't develop and improve everything within our concept. We think there are still some issues to be resolved that would really improve the UX for the clients in a way they really can use the product as a service without the help from WallScope. Features such as elastic search, CRUD for linked data and working with multiple sessions and users. Those features would not only improve UX but also productivity within a company. We think that the product as it is right now gives the user a nice overview of how structured data is linked to each other. And that this is an easy approach to working with linked data for the less tech savvy people that would be working with this product.
Future Improvements
Sources
D3 JavaScript Library W3C About RDF Turtle Syntax .ttl Lighthouse Audit Documentation Product Biography