Dashboard features - ram290476/investor-dashboard GitHub Wiki
Dashboard features
What the Investor Dashboard is designed to do, based on the mockups and notes under design/ai-generated/ (especially ui_investor-dashboard-ui_README.md, Main.dc.html, and Mobile.dc.html). Those files are design references; the live site is the zero-build app in apps/web/. Sample numbers in the mockups are not live market data.
Screenshots below are the design-roadmap captures on main (docs/design-roadmap/) — the same images used on the Dashboard roadmap issues. They show design sample data, not the live lake.
| Source | Role |
|---|---|
design/ai-generated/ui_investor-dashboard-ui_README.md |
Desktop / mobile layout summary |
design/ai-generated/Main.dc.html |
Hi-fi desktop stock view (fluid ~1440 wide) |
design/ai-generated/Mobile.dc.html |
Phone glance view (390×844), earlier two-stock layout |
apps/web/ |
Deployable Cognito-gated UI (subset of the full design) |
docs/design-roadmap/*.png |
Annotated screenshots for roadmap issues |
Related: Data collectors API keys, Continuous deployment, Deployment issues, Dashboard roadmap.
Purpose
A private, data-driven market dashboard for watching focus names (design centers on TSLA and SPCX, with a personal watchlist beyond that), reading price and macro context on one time axis, and seeing company-specific and news signals without leaving a single dark desktop shell. Sign-in is required; preferences are per account.
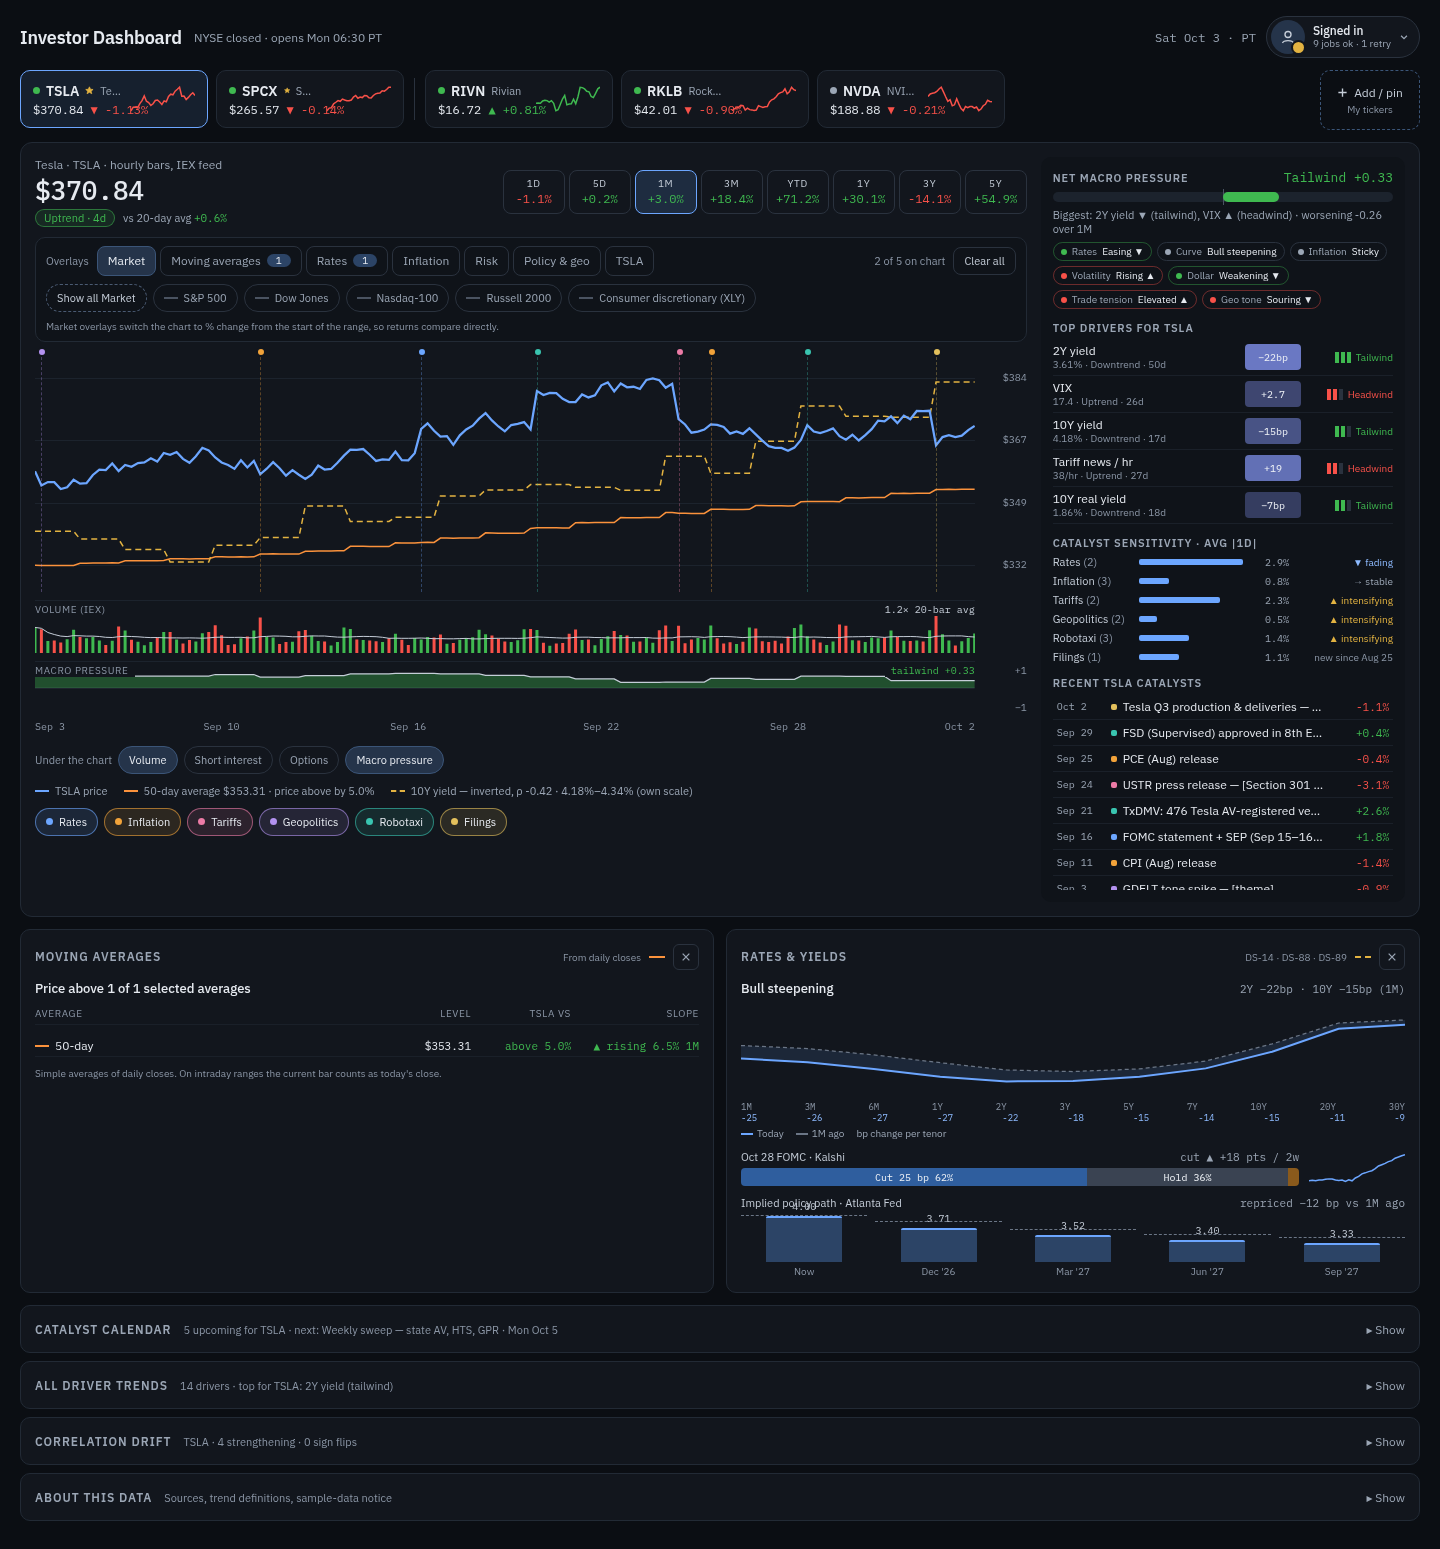
Full desktop artboard — header, watchlist, chart + signals, and macro/theme panels (#27).
Desktop stock view (design)
Layout from the Main artboard / README, top to bottom:
1. Header and account
- Brand title Investor Dashboard
- Market / session context and a path into data freshness (batch job schedule)
- Account menu: My tickers (add · pin · reorder), Display (time zone · colors), and related settings
(Visible at the top of the full desktop shot.)
2. My tickers (watchlist strip)
- Horizontal strip of tickers; selecting one drives everything below for that symbol only
- Pinned symbols (gold star, design cap 6) stay at the front of the bar
- Add / pin opens settings to search tickers, pin, reorder, or remove
- Each chip shows symbol, short name, and price / change styling
Roadmap: #24 Watchlist pin, reorder, and My tickers settings UX.
3. Selected-stock overview
- Last price, day change, and period returns
- Period chips (e.g. 1D / 1W / 1M / …): pick the return window used for the chart focus
- Overview is always scoped to the selected ticker
4. Unified chart area
One chart stack, shared time axis:
| Piece | What it does |
|---|---|
| Price chart | Daily closes with optional moving averages |
| Macro overlays | Toggle series (rates, indices, etc.) onto the same axis via overlay group tabs |
| Catalyst markers | Event dots on the chart (filterable categories) |
| Lanes under the chart | Optional secondary bands (e.g. volume, short interest, options, macro pressure) |
Overlay groups in the design include tabs such as Market, averages, rates, inflation, vol, FX/oil, tariffs/geo, company-specific, and news — each with detail cards below.
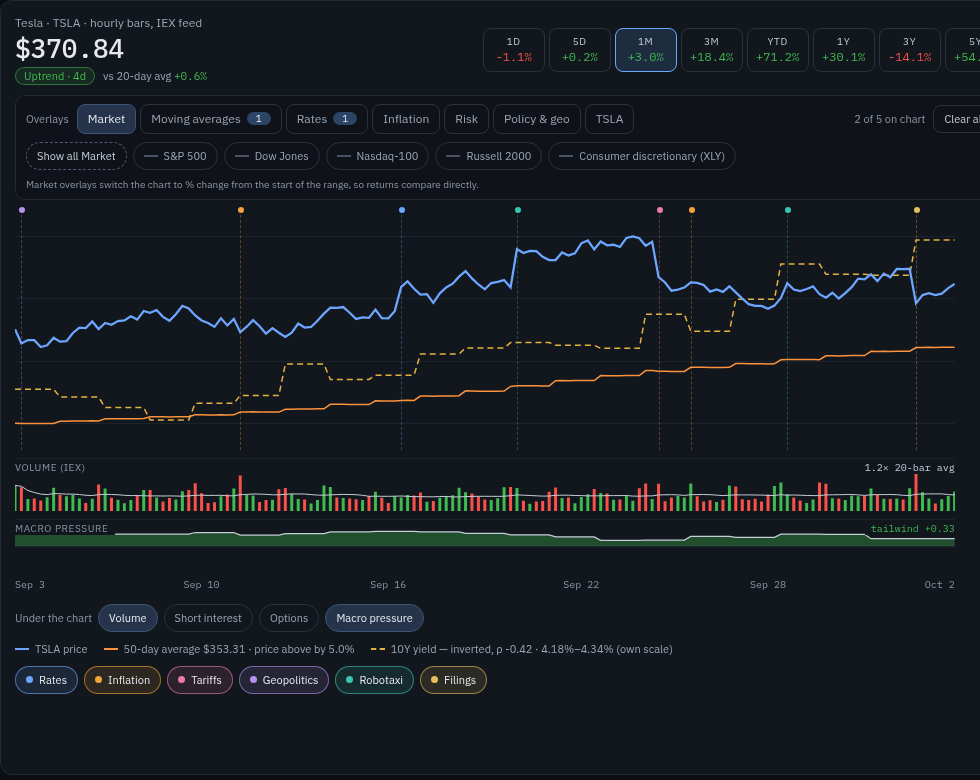
Price chart with overlay tabs, catalyst markers, and lanes (#17, #19).
5. Signals column (beside the chart)
| Block | What it does |
|---|---|
| Net macro pressure | Single score / word (−1 headwind … +1 tailwind) summarizing macro effect on the selected name |
| Regime pills | Compact regime labels (rates, inflation, geo tone, etc.) |
| Top drivers | Ranked macro / factor drivers for the selected symbol |
| Catalyst sensitivity | Typical |1-day| move around catalyst types |
| Recent catalysts | Latest events tagged to the selected symbol |
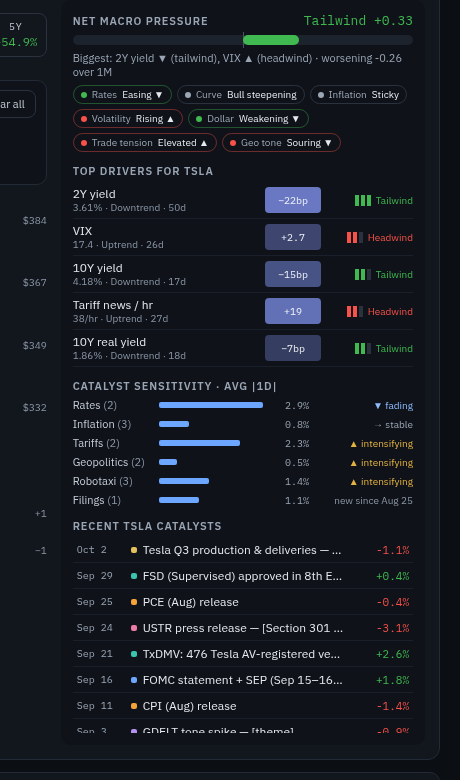
Signals column for the selected symbol (#18).
6. Macro and theme panels (detail cards)
Collapsible / dismissible cards that deepen an overlay group:
| Panel | Intent |
|---|---|
| Market comparison | Index ETFs vs the name (jobs H1/D4 in the design labels) |
| Moving averages | MA state from daily closes |
| Rates & yields | Curve, cut odds, related series |
| Inflation surprise | CPI / nowcast-style surprise context |
| Volatility | VIX-style and related sparklines |
| Dollar & oil | DXY / WTI-style context |
| Tariffs & geopolitics | Trade / geo tone and trackers |
| Tesla · robotaxi (when TSLA) | Fleet / permit / FSD-style ops trends |
| Tesla · fundamentals | Quarterly company metrics |
| SpaceX · ops & contracts (when SPCX) | Launch / contract / ops trends |
| News sentiment | Rolling sentiment for the selected symbol |
Company panels switch with the selected stock (robotaxi / fundamentals for TSLA; ops and contracts for SPCX).
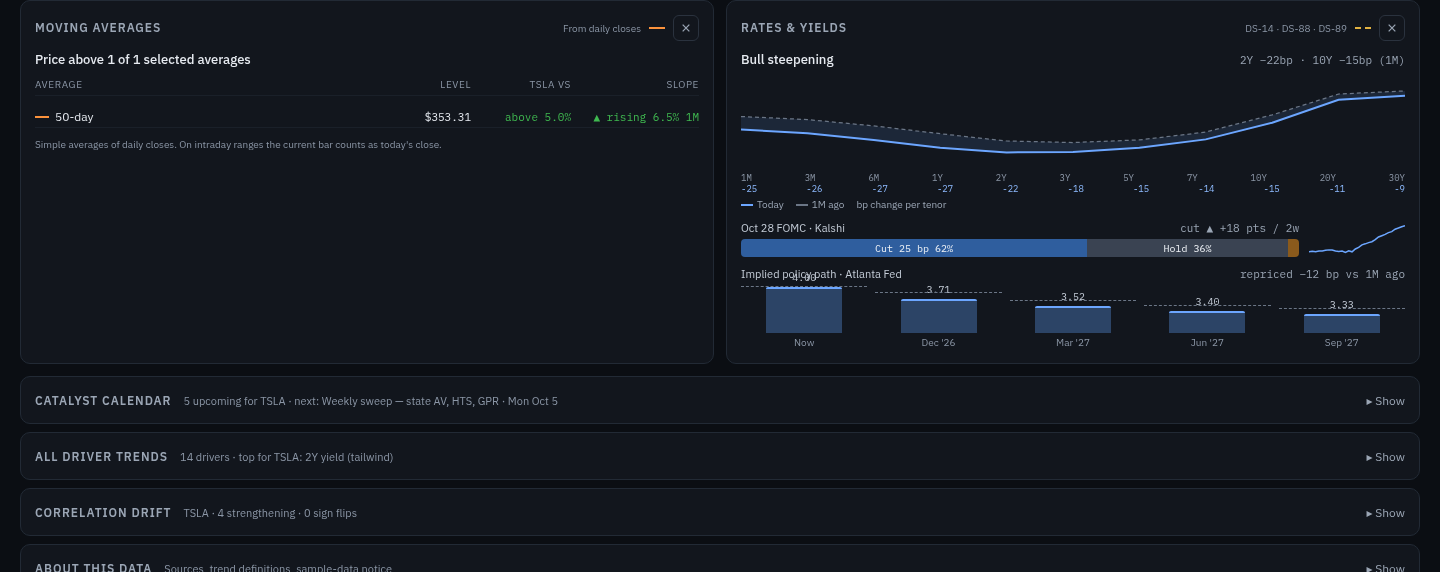
Detail cards under the chart — market, rates, inflation, company themes, news (#20, #21, #22).
7. Drawers
The bottom panels are collapsible drawers (#86). Each header is a button with a chevron, the title, a one-line summary, and Show/Hide. Collapsed, only that header is shown. Expanded, the panel body is the same content as before. The header uses aria-expanded and aria-controls, and Enter or Space toggles it.
Open and closed state is saved per user in preferences (display.panels) and is shared across tickers and devices. With no saved state, Rates & yields, Inflation & release links, Moving averages, and the company panel start open. Market comparison, Volatility, Dollar & oil, Tariffs & geopolitics, Correlation drift, Catalyst calendar, Government contracts, and About this data start collapsed.
Choosing a chart catalyst or a calendar event opens the Catalyst calendar and moves to that event. The Inflation panel still has an inner Release calendar disclosure. All driver trends stays inside the Macro signals card. Collection schedules stay in Account settings, not a bottom drawer.
| Drawer | What it does |
|---|---|
| Rates & yields, Inflation & release links, Market comparison, Moving averages, Volatility, Dollar & oil, Tariffs & geopolitics | Detail under the chart; collapsed headers show a one-line summary |
| Correlation drift | How correlations with the selected name have been moving |
| Catalyst calendar | Upcoming and past catalysts |
| Company panel | Tesla, SpaceX, or the selected ticker's company themes. One saved open/closed state for every ticker |
| Government contracts | Trailing-12-month awards when that data exists |
| About this data | Provenance and methodology |
| All driver trends | Full driver list with sort, inside Macro signals rather than a bottom drawer |
Roadmap: #19 (calendar), #23 (first drawers), #86 (every bottom panel, saved per user). Layout context is in the full desktop shot.
8. Display preferences
- Time zone (design: PT / ET; live prefs also support IANA zones via the API)
- Up/down palette — green/red, blue/orange, or similar accessible pairs (avoids relying on hue alone)
Mobile glance view (design)
Mobile.dc.html is a phone artboard (~390×844) with a four-tab glance layout. It still reflects an earlier two-stock (TSLA / SPCX) focus rather than the full desktop watchlist. Treat it as the mobile direction: quick status, not a full parity port of every desktop panel.
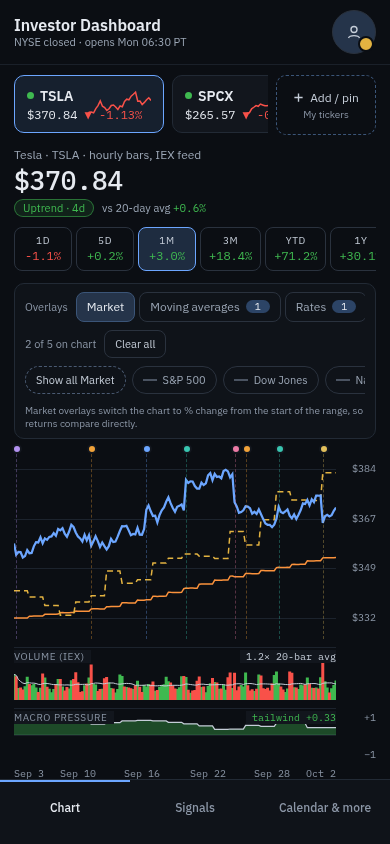
Phone glance mockup (#25).
Trend metrics the design expects from the backend
The mock computes demo series in the browser; production is meant to read a serving trend_metrics (or equivalent) keyed by (series_id, date), including roughly:
- 1W / 1M / 3M change and z-score
- 1-year range percentile
- Trend state (price vs 20/50-day averages) and days in state
- Rolling 30D / 90D correlation with TSLA and SPCX daily returns
- Effect ≈ ρ(90D) × 1M z; net pressure ≈ tanh(Σ effect / 3)
Design note: refresh after daily price jobs (D4) and macro release jobs (M1). Not every catalog job is wired in the live stack yet — see docs/operations.md.
Roadmap: #26 Serving layer: trend_metrics. The signals screenshot shows how those metrics surface in the UI.
Implemented application scope
The Cognito-gated application reads /dashboard, /chart/{ticker}, /status, and /prefs.
The following features are implemented on main by #73
and #74 (the #27 roadmap PR), with
the observed-sentiment correction in #75
and chart-control reorganization for #76 in #77.
The combined production deployment 37871740984
succeeded after user approval on October 9, 2026 UTC. Published application assets match
release commit 1eeea95 byte-for-byte. The deployed dashboard builder then published schema-v3
serving data with 26 TSLA and 10 SPCX observed sentiment points. This verifies deployment
and serving data, not a fresh production Cognito sign-in.
The newer #76 changes are verified on main but are not included in that production verification;
production deployment retains its existing approval gate.
| Implemented | Notes |
|---|---|
| Sign-in gate | Cognito PKCE; password-only sign-in (MFA off) at present |
| Watchlist | Horizontal, keyboard/touch/mouse accessible strip; external fixed Add/pin control; 25 per account, non-destructive grandfathering |
| Price chart | Period/ticker-aware available overlay groups; pinned Clear all; fixed Volume → Short interest → Macro pressure → Options lanes; below-chart lane controls/Hide all followed by in-window catalyst controls/Clear all |
| Fundamentals | Seven supported generic quarterly overlay choices; unavailable items/empty groups hidden by #76, superseding #71's disabled chips; bottom table intentionally removed |
| Signals | Net pressure, numerical ranked effects, price/macro regime pills, paired-release sensitivity and recent catalysts |
| Detail panels | Market comparisons, full-window moving averages, rates, inflation/release links, volatility, dollar/oil and policy-uncertainty proxy |
| Company themes | Tesla reported fundamentals and scoped events; SpaceX launch events and existing government awards; explicit missing operating feeds |
| News sentiment | Seven-calendar-day rolling history and NEWS:SENTIMENT overlay; ticker-scoped finite scores, up to 90 observed dates; unobserved dates remain gaps, isolated observations are visible, dated legend |
| Drawers | Bottom panels collapse to a title and one-line summary. Open/closed state is saved per user and kept across reload, ticker, and period changes. All driver trends stays sortable inside Macro signals |
| Schedules | Header data timestamp opens schedule/source-health settings; separate refresh reloads serving documents |
| Display | Six persistent themes and up/down/time-zone preferences |
| Mobile | Chart / Signals / Calendar / More tabs retained for the new panels |
| Account | Signed In header label; Account menu and Account settings dialog names unchanged; icon-only phone header |
Hidden saved overlays/lanes remain in preferences and return when aligned data returns. Empty overlay/lane selections persist per ticker; catalyst Clear all remains session-only, and choosing a calendar event re-enables its category. Lane render order never changes stored selection order. The five-overlay cap evicts hidden choices first when adding new selections. Loading/failed refreshes keep known chart-backed controls, without drawing stale historical values. Four #76 implementation captures use captured live market data and mock authentication/preferences; older Account labels and unavailable-chip screenshots remain historical references.
Not live measurements: Tesla robotaxi fleet/state-permit/regional-FSD counts, active satellite counts and a measured SpaceX launch-cadence series have no structured published feed. Design sample counts are never used as substitutes. Sensitivity reports finite release-linked correlations and sample sizes (minimum 12 paired releases), not fabricated typical absolute moves or causal forecasts. Existing provider failures remain tracked in #69.
Implementation captures under docs/design-roadmap/issue-27/ use captured live market
data and real stored news scores with mock authentication/preferences. They do not prove
production sign-in or deployment. See operations
for serving contracts, source gaps and marker alignment.
Design vs data honesty
- Mockup figures and these screenshots are samples except a few dated facts called out in the UI README.
- Do not publish
design/as the site; Deploy publishesapps/web/only (Continuous deployment). - Dark industrial chrome, monospace stats, and accessible up/down colors are intentional product vocabulary from the canvas.
Related wiki
- Data collectors API keys — credentials that feed collectors behind these panels
- Continuous integration / Continuous deployment — how the live UI is tested and shipped
- Build issues / Deployment issues — rollout lessons