Home - quantifiedstudent/QS-Dashboard GitHub Wiki
- QS-dashboard
The quantified student dashboard has a lot of graphs. To create and configure every graph by hand is not very scalable. So in order to make the process of adding and generating graphs easier I have made this a totally generic process which I will walk you through in this documentation.
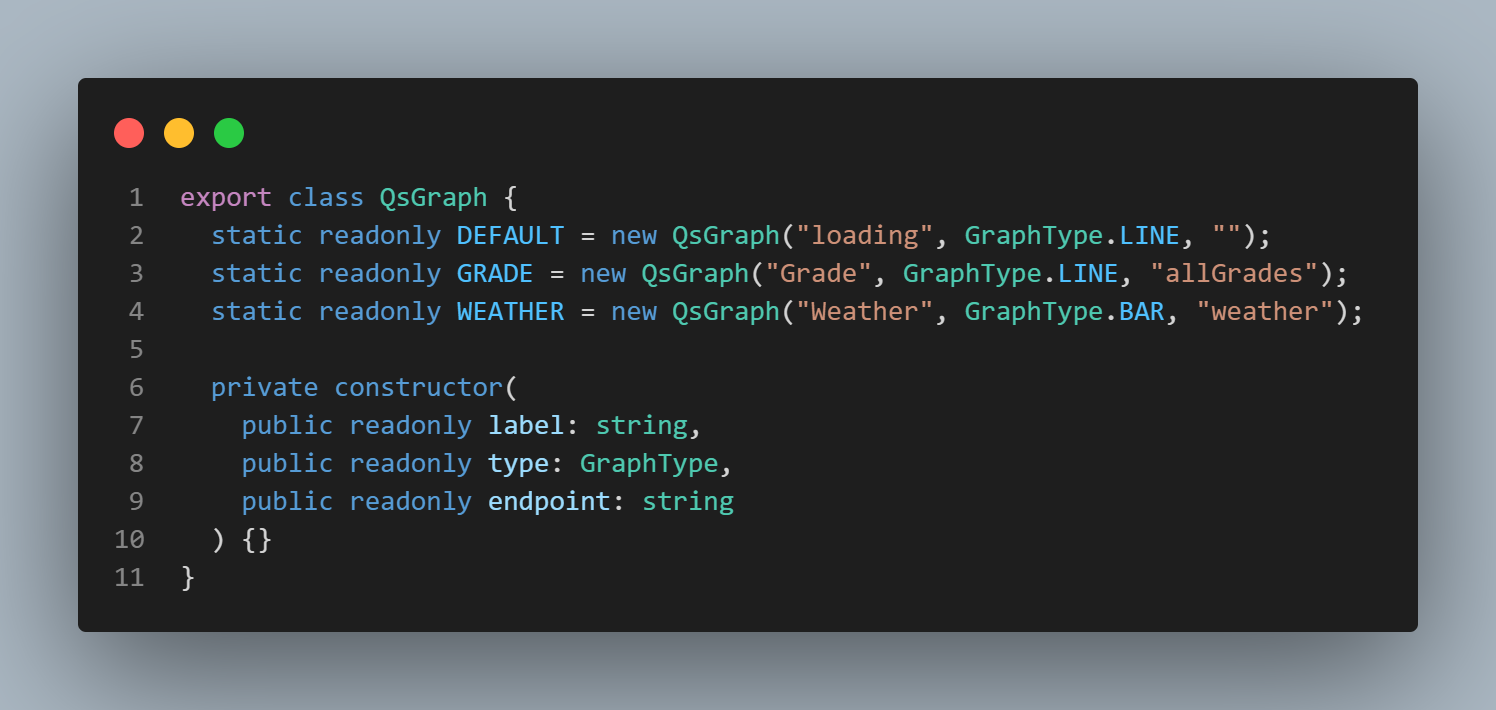
There are a few components and classes to this graph generation process. The main thing is an array of ChartContainer objects which hold the charts. These chart containers are then being displayed in the modular grid. But there is one step above displaying the graph and that is the graph definition. In the dashboard you are able to select the graph you want to add to the dashboard. These different graphs are pre-defined by the class QsGraph