Week 1: Get started Part 06. Diagnostic Quiz - quanganh2001/Google-Data-Analytics-Professional-Certificate-Coursera GitHub Wiki
Optional: Familiar with data analytics? Take our diagnostic quiz
- Optional speed track for those experienced in data analytics
The Google Data Analytics Certificate provides instruction and feedback for learners hoping to earn a position as an entry-level data analyst. While many learners will be brand new to the world of data analytics, others may be familiar with the field and simply wanting to brush up on certain skills.
If you believe this course will be primarily a refresher for you, we recommend taking this practice diagnostic quiz. It will enable you to determine if you should follow the speed track, which is an opportunity to proceed to Course 2 after taking each of the Course 1 Weekly Challenges and the overall Course Challenge. Learners who earn 100% on the diagnostic quiz can treat Course 1 videos, readings, and activities as optional. Learners following the speed track are still able to earn the certificate.
If you aren't familiar with data analytics, this course was made for you! Feel free to skip this quiz and move forward through all of the course material.
Get ready to take the next step in your data analytics journey with the question below!
A clothing retailer collects and stores data about its sales revenue. Which of the following would be part of its data ecosystem? Select all that apply.
- The clould that store its database
Explain: The clothing retailer’s data ecosystem would include the database of sales revenue, the cloud that stores the database, and records of its inventory. A data ecosystem is the various elements that interact with one another in order to produce, manage, store, organize, analyze, and share data.
- The database of sales revenue
Explain: The clothing retailer’s data ecosystem would include the database of sales revenue, the cloud that stores the database, and records of its inventory. A data ecosystem is the various elements that interact with one another in order to produce, manage, store, organize, analyze, and share data.
- The databases of competing retailers
- Records of its inventory
Explain: The clothing retailer’s data ecosystem would include the database of sales revenue, the cloud that stores the database, and records of its inventory. A data ecosystem is the various elements that interact with one another in order to produce, manage, store, organize, analyze, and share data.
- What is the process of guiding business strategy using facts?
A. Identification of data and decisions
B. Strategic improvement
C. Data-driven decision-making
D. Analytical planning
The correct answer is C. Explain: Data-driven decision-making is the process of guiding business strategy using facts.
- Fill in the blank: Curiosity, understanding context, having a technical mindset, data design, and data strategy are _____. They enable data analysts to solve problems using facts.
A. thought processes
B. analytical skills
C. personal insights
D. business skills
The correct answer is B. Explain: Curiosity, understanding context, having a technical mindset, data design, and data strategy are analytical skills. They enable data analysts to solve problems using facts.
- The owner of a skate shop notices that every time a certain employee has a shift, there are higher sales numbers at the end of the day. After some investigation, the owner realizes that since the employee was hired, the store earns 15% more each month. In this scenario, the manager used which quality of analytical thinking?
A. Problem-orientation
B. Big-picture thinking
C. Visualization
D. Correlation
The correct answer is D. Explain: The owner used correlation, which involves being able to identify a relationship between two or more pieces of data. They noticed that there is a correlation between the employee’s presence and the skate shop’s traffic and monthly income.
- Gap analysis is a process that could help accomplish which of the following tasks? Select all that apply.
- Spread awareness about income inequality based on local salaries
- Increase the efficiency of a car manufacturer based on its current assembly process
Explain: Gap analysis is a method for examining and evaluating how a process works currently in order to get where you want to be in the future. Improving accessibility, increasing efficiency, and reducing carbon emissions are examples of improvements that gap analysis can help accomplish.
- Improve accessibility for an educational app based on its current functionality
Explain: Gap analysis is a method for examining and evaluating how a process works currently in order to get where you want to be in the future. Improving accessibility, increasing efficiency, and reducing carbon emissions are examples of improvements that gap analysis can help accomplish.
- Reduce a company’s carbon footprint based on its current emissions
Explain: Gap analysis is a method for examining and evaluating how a process works currently in order to get where you want to be in the future. Improving accessibility, increasing efficiency, and reducing carbon emissions are examples of improvements that gap analysis can help accomplish.
- An advertising firm has used insights from its analytics team to create a strategy for improving sales. Now, they implement a plan to increase annual revenue. The firm is at which step of the data analysis process?
A. Process
B. Act
C. Share
D. Analyze
The answer is B. Explain: The act phase is when insights are put into action. This involves a company or organization implementing a plan to solve the original business problem.
- A data analyst adds descriptive headers to columns of data in a spreadsheet. How does this improve the spreadsheet?
A. It adds context
B. It clarifies the business strategy
C. It eliminates unnecessary details
D. It improves the aesthetic appeal
The answer is A. Explain: Adding descriptive headers to columns of data in a spreadsheet adds context. Context is the condition in which something exists, such as a structure.
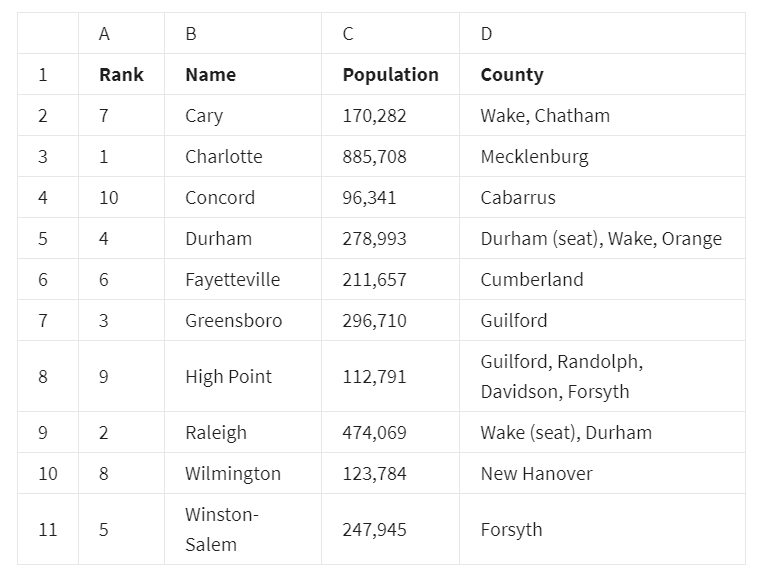
- This is a selection from a spreadsheet that ranks the 10 most populous cities in North Carolina. To alphabetize the county names in column D, which spreadsheet tool would you use?
A. Organize range
B. Sort range
C. Alphabetize range
D. Name range
The answer is B. Explain: You can use sort range to alphabetize the county names in column D. Sorting a range of data from A to Z helps data analysts organize and find data more quickly.
- You are querying a database of manufacturing company suppliers. The column name for supplier identification numbers is supplier_id. What is the correct clause to retrieve only data about the supplier with identification number 85317?
A. COLUMN supplier_id = 85317
B. SELECT supplier_id 85317
C. FROM supplier_id 85317
D. WHERE supplier_id = 85317
The answer is D. The correct clause is WHERE supplier_id = 85317. This clause tells the database to return only information about the supplier whose ID is 85317.
- Imagine you are sharing your data with a company stakeholder. Why might you display data with a data visualization instead of a table? Select all that apply.
- It helps them identify trends more quickly
Explain: When sharing data with others, you might use a data visualization instead of a table because visualizations are more aesthetically pleasing, save time when identifying trends, and are easier to understand.
- [] It thoroughly describes each data point
- It’s easy to understand
Explain: When sharing data with others, you might use a data visualization instead of a table because visualizations are more aesthetically pleasing, save time when identifying trends, and are easier to understand.
- It’s aesthetically pleasing
It is false statement