The Art of Writing Efficient Programs - pykello/pykello.github.com GitHub Wiki
- perf profiler
sudo apt install linux-perfsudo yum install perf
- google-perftools
sudo apt install google-perftoolssudo yum install google-perftools
- Google benchmark
sudo ln -s /lib64/libprofiler.so.0.4.16 /lib64/libprofiler.so
Repo: https://github.com/PacktPublishing/The-Art-of-Writing-Efficient-Programs
First example:
$ clang++ -g -O3 -mavx2 -Wall -pedantic 01_substring_sort_a.C 01_substring_sort.C -o example && ./example
Compile & run with profiling data:
$ clang++ -g -O3 -mavx2 -Wall -pedantic 01_substring_sort_a.C 01_substring_sort.C -lprofiler -o example
$ CPUPROFILE=prof.data ./example
$ pprof --text ./example prof.data
#include <chrono>
using std::chrono::duration_cast;
using std::chrono::milliseconds;
using std::chrono::system_clock;
  …
auto t0 = system_clock::now();
  … do some work …
auto t1 = system_clock::now();
auto delta_t = duration_cast<milliseconds>(t1 – t0);
cout << "Time: " << delta_t.count() << endl;double duration(timespec a, timespec b) {
return a.tv_sec - b.tv_sec + 1e-9*(a.tv_nsec - b.tv_nsec);
}
…
{
timespec rt0, ct0, tt0;
clock_gettime(CLOCK_REALTIME, &rt0);
clock_gettime(CLOCK_PROCESS_CPUTIME_ID, &ct0);
clock_gettime(CLOCK_THREAD_CPUTIME_ID, &tt0);
constexpr double X = 1e6;
double s = 0;
for (double x = 0; x < X; x += 0.1) s += sin(x);
timespec rt1, ct1, tt1;
clock_gettime(CLOCK_REALTIME, &rt1);
clock_gettime(CLOCK_PROCESS_CPUTIME_ID, &ct1);
clock_gettime(CLOCK_THREAD_CPUTIME_ID, &tt1);
cout << "Real time: " << duration(rt1, rt0) << "s, "
"CPU time: " << duration(ct1, ct0) << "s, "
"Thread time: " << duration(tt1, tt0) << "s" <<
endl;
}Uses hardware performance counters & time-based sampling. It doesn't require any instrumentation of the code.
$ perf stat ./example
Sort time: 87ms (292894 comparisons)

 Performance counter stats for './example':

             89.66 msec task-clock:u              #    0.995 CPUs utilized
                 0      context-switches:u        #    0.000 K/sec
                 0      cpu-migrations:u          #    0.000 K/sec
               210      page-faults:u             #    0.002 M/sec
         282136715      cycles:u                  #    3.147 GHz
        1279044290      instructions:u            #    4.53  insn per cycle
         255987321      branches:u                # 2855.090 M/sec
            361680      branch-misses:u           #    0.14% of all branches

       0.090112799 seconds time elapsed

       0.088907000 seconds user
       0.001001000 seconds sys
To get a list of events that can be counted:
$ perf list
To collect specific events:
$ perf stat -e cycles,instructions,branches,branch-misses,cache-references,cache-misses ./example
Detailed report:
$ perf record -c 10000 ./example
Sort time: 103ms (292894 comparisons)
[ perf record: Woken up 2 times to write data ]
[ perf record: Captured and wrote 0.334 MB perf.data (10583 samples) ]

$ perf report
Uses hardware performance counters. Requires link-time instrumentation.
$ clang++ -g -O3 -mavx2 -Wall -pedantic 01_substring_sort_a.C 01_substring_sort.C -lprofiler -o example
$ CPUPROFILE=prof.data CPUPROFILE_FREQUENCY=1000 ./example
$ pprof --text ./example prof.data
Produce call graph:
$ google-pprof --pdf ./example prof.data > prof.pdf
#include "benchmark/benchmark.h"
...
void BM_loop_int(benchmark::State& state) {
  /* setup is free ... */
  const unsigned int N = state.range(0);
  ...
  /* ... what is measured goes into the body of benchmarking loop */
  for (auto _ : state) {
     benchmark::DoNotOptimize(compare_int(s1, s2));
  }
  state.SetItemsProcessed(N*state.iterations());
}
BENCHMARK(BM_loop_int)->Arg(1<<20);
BENCHMARK_MAIN();
$ GBENCH_DIR=/usr/local
$ clang++ -g -O3 -mavx2 -Wall -pedantic -I$GBENCH_DIR/include 10_compare_mbm.C $GBENCH_DIR/lib64/libbenchmark.a -pthread -lrt -lm -o benchmark
$ ./benchmark --benchmark_repetitions=10 --benchmark_report_aggregates_only=true
2022-05-10T00:22:26-04:00
Running ./benchmark
Run on (8 X 3400 MHz CPU s)
CPU Caches:
  L1 Data 32 KiB (x4)
  L1 Instruction 32 KiB (x4)
  L2 Unified 256 KiB (x4)
  L3 Unified 6144 KiB (x1)
Load Average: 0.00, 0.00, 0.00
***WARNING*** CPU scaling is enabled, the benchmark real time measurements may be noisy and will incur extra overhead.
-------------------------------------------------------------------------------------
Benchmark                           Time             CPU   Iterations UserCounters...
-------------------------------------------------------------------------------------
BM_loop_int/1048576_mean       329182 ns       328729 ns           10 items_per_second=3.18979G/s
BM_loop_int/1048576_median     329079 ns       328632 ns           10 items_per_second=3.19073G/s
BM_loop_int/1048576_stddev        328 ns          323 ns           10 items_per_second=3.13026M/s
BM_loop_int/1048576_cv           0.10 %          0.10 %            10 items_per_second=0.10%
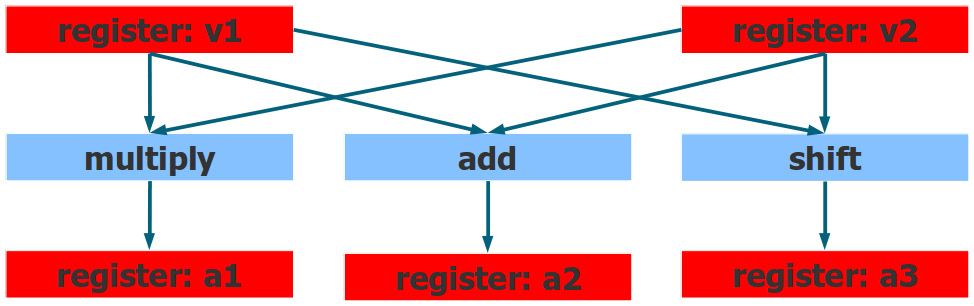
CPU can execute multiple instructions at a time:
#define MCA_START __asm volatile("# LLVM-MCA-BEGIN");
#define MCA_END __asm volatile("# LLVM-MCA-END");
           …
         for (size_t i = 0; i < N; ++i) {
MCA_START
                 a1 += p1[i] + p2[i];
MCA_END
           }
The analyzer assumes that the selected code fragment runs in a loop.
$ clang++-11 01_superscalar.C -g -O3 -mavx2 --std=c++17 -mllvm -x86-asm-syntax=intel -S -o - | llvm-mca-11 -mcpu=core-avx2 --timeline -o 1.txt
Pipelining
Register renaming: The register names you see in the program, are not the real register names, they are mapped by the CPU to the actual physical registers. The same name, can be mapped to different registers that all have the same size and functionality.
loop unrolling: usually done by compiler, but can be done in hardware to deal with data dependencies.
Out-of-order execution
Many processors have some sort of conditional add or conditional move (cmove) which can make the program sequential.