Analyzer Architecture - prasadtalasila/BITS-Darshini GitHub Wiki
Overview
Analyzer module forms the backbone for the entire web application. The analyzer module is responsible for taking in a filtered stream of packets and analyzing these packets. The filtered packets can come from two sources, namely the live network interface or a pcap file. The libpcap kernel module is utilized for providing the requisite filter functionality. In the parlance of Wireshark lingo, the filter discussed so far is referred to as capture filter.
The analyzer module takes in the filtered stream of packets, performs protocol detection and analysis on the packets, and persists (stores) the result in the database. Apart from the pcap file, the analyzer module also takes the protocol parse graph as input. Now let us take an overview of each of the components of the analyzer module.
Protocol Parse Graph
The idea of protocol parse graph is a very old one [Mogul1987, McCanne1993]. A variation of protocol parse graph called Berkeley Packet Filter (BPF) is used in the tcpdump [TCPDump], and Linux socket filter [LSF]. In these instances, the parse graph is typically used to select packets of interest. Our purpose is to parse the incoming packets in order to detect the protocol stack of the packet. Most of the networking equipment uses protocol parse graphs in order to extract the headers of different protocols. A sample protocol parse graph taken from [Gibb2013] is shown below.
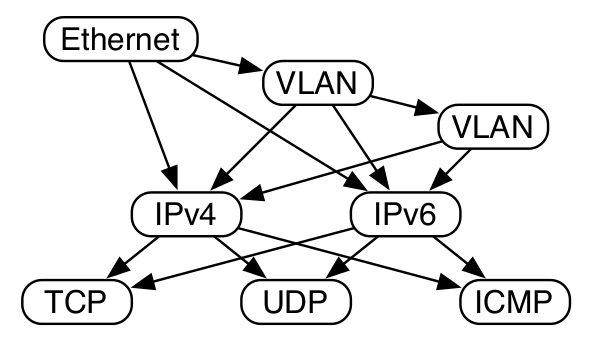
Path traversal in the protocol parse graph is equivalent to ordered extraction and processing of the payload of a packet. The extraction and processing strictly follows the ordering of protocols encountered in the path chosen. In most cases, the path is chosen dynamically based on the payload type fields of the present header under consideration. The widely used state machines design and implementation techniques can be used for realizing the protocol parse graphs. In the process of mapping the protocol parse graph to an equivalent state machine representation, we perform the following transformations.
- All the nodes of the parse graph become corresponding nodes of the state machine.
- The payload type field becomes the pre-condition for traversal from one state to another state.
- The parsed header fields, if any, become the outputs of a state. The payload extracted in a state also becomes input to the next set of states.
The equivalent state machine representation for the parse graph shown in the previous diagram is given below.
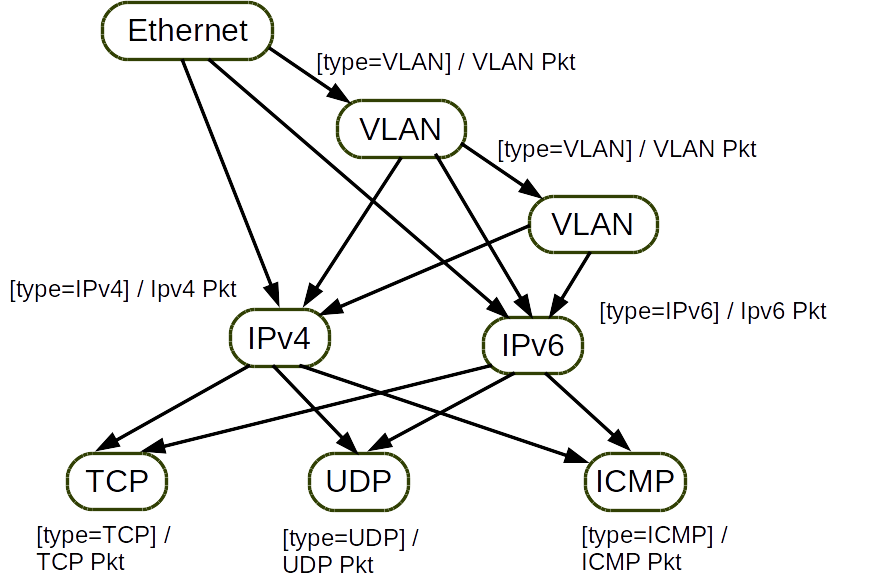
The transition to each state has the same pre-condition and the same output. For the sake of clarity, the pre-condition and the output are put near the state rather than on the state transition lines.
A protocol parse graph can be implemented in two ways. One is the synthesis of the parse graph state machine onto ASICs with TCAM [Gibb2013], and onto the commercially available FPGA architectures [Attig2011]. A survey of the hardware implementations of the protocol parse graph techniques, paraphrased as packet classification techniques is available in [Kumar2015]. The other is a software implementation of the parse graphs as done in the packet analysis tools such as tcpdump[Tcpdump] and Wireshark[Wireshark].
The software / hardware implementations of the protocol parse graphs can either be a fixed or a programmable kind. A fixed parse graph can only parse the protocol sequences that are part of the given parse graph. On the other hand, a programmable parse graph can dynamically select a parse graph at the run time. The design trade offs involved in the fixed vs programmable parsers are discussed in [Gibb2013].
As discussed else where in the wiki pages, the protocol parse graph is represented using the parse graph representation of the P4 language[P4lang].
Realization of Parse Graph Using Pipeline Execution
We are building a web application for high throughput packet analysis scenarios. Hence, pipeline implementation of the parse graph state machine would be appropriate. The proposed pipeline architecture for the parse graph is shown below.
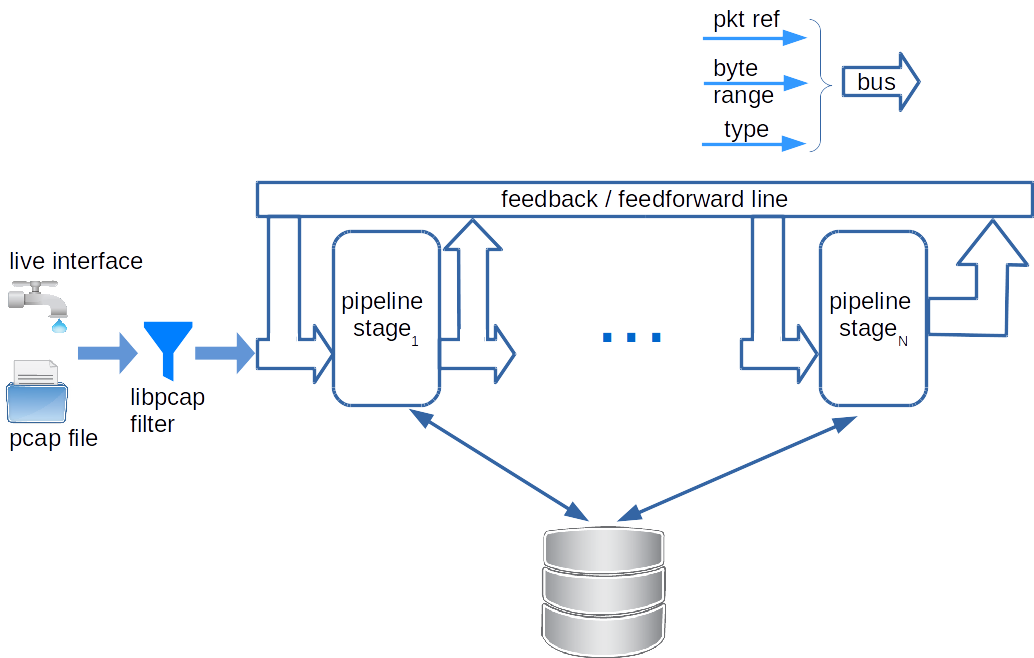
The analyzer module takes the help of libpcap.so kernel module to obtain the filtered packets. The filtered packets are fed into the pipeline. Each stage of the pipeline corresponds to one layer of TCP/IP reference model. All the pipeline stages are aware of the protocol processing capabilities of each other. After a payload type has been determined, a pipeline stage can select appropriate next pipeline stage. Based on the next pipeline stage selection, the packet can be sent to the appropriate pipeline stage on the feedback / feedforward line.
Each pipeline stages takes three inputs: packet reference, byte range to parse and the type of packet. The specified byte ranges are processed as if they are the PDU of the type specified on the type input line. The code extracts required header fields from the PDU, determines the type, computes the byte offsets for the payload. All of this information is passed onto the next stage in the pipeline. In order to take care of tunneling scenarios, there is a feedback line that connects a stage to itself or a later pipeline stage to a former pipeline stage.
It is possible to encounter packets that do not have PCI header for a layer (ex: raw packets with only TCP header would obviously miss the IP header). Feed forward line enables skipping of a pipeline stage where necessary.
The communication between the pipeline stages happens on a bus which is nothing but a collection of packet reference, byte range offsets and the type. All the three variables are related and can be sent across as one single item on the bus. Since the implementation is being done inside an OOP environment, all the three variables can be put inside an object and the object can be sent across.
Details of One Pipeline Stage (Generic Analyzer Cell)
All the pipeline stages are created from the same template named generic analyzer cell. The block diagram of the generic analyzer cell is shown below.
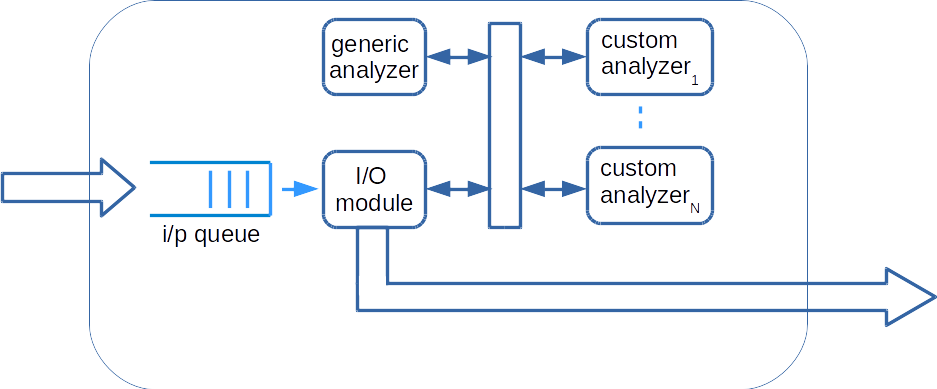
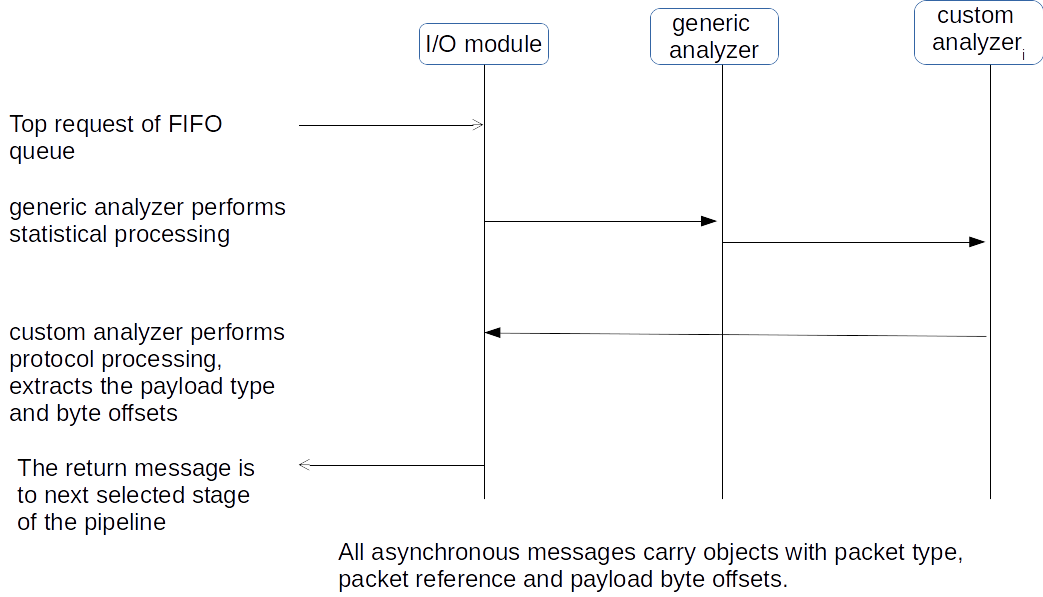
All the incoming requests come in as objects. These requests are placed in a FIFO queue of finite size. The I/O module takes one incoming object at a time, sends the object reference to generic analyzer for flow / statistical record keeping purposes. The I/O module also informs the registered custom analyzers of the available packet for parsing. One of the custom analyzer's pick up the packet, complete the parsing and give a new object to the I/O module. The I/O module, based on the type of the outgoing object, places it in the incoming queue of the correct pipeline stage.
Fast and slow paths of an analyzer
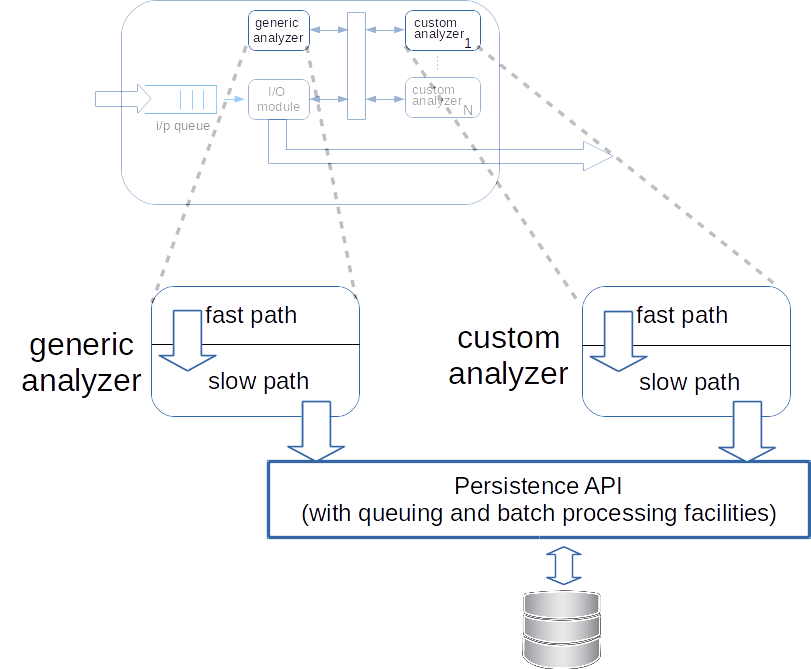
The reception, parsing and generation of the type/payload/pipeline output constitutes the faster execution path of a pipeline stage. The computation of headers, sanity checking and storing of the computed/extracted header fields into the database constitute the slower execution path of a pipeline stage. A pipeline stage decouples the faster and slower execution paths. As soon as the output of the faster execution path is ready, the output is passed on to the next pipeline stage.
The slower execution path of a pipeline stage can have long input and output queues to adjust to the packet processing throughput disparity between the fast path and the persistence API.
Event Bus in a Cell
There is a shared bus in each analyzer cell. This shared bus is to be implemented using the Publisher-Subscriber design pattern. Each layer has a generic analyzer and multiple custom analyzers which perform protocol specific analysis. These together are treated as a single entity namely a cell. These cells are the stages in the Pipeline parse graph architecture discussed in the previous section. Currently there is only one eventbus which has the generic analyzers in the role of a publisher and custom analyzers in the role of subscribers.
Whenever a cell receives a packet, either passed on from the previous cell or from the tap in case of first cell, it treats it as an event. The generic analyzer then performs a simple analysis and wraps the relevant objects in a corresponding event object. This event object is then posted to the corresponding eventbus. The custom analyzers which are subscribed to corresponding eventbus receive the event object and can proceed to perform their own custom analysis.
Factory method design pattern is observed for an eventbus of a layer.
If users want to add a custom analyzer as a hook in a particular cell, they have to create a class which has the following method -
@Subscribe
public void analyzeCustomLayer (XYZLayerEvent event) {
    //do stuff
}
If users want to add their own cell then they have to define following entities -
- Generic Analyzer - The first point of interception of packets
- Layer Event - Corresponding event object for that layer which wraps all the essential objects in order to be analyzed by custom hooks attached to it.
- EventBus - Autowire the EventBusFactory instance. Create the eventBus with a specific unique id (which is a string) using getEventBus(String id) method.
Hooks can be defined and attached as described above.
Configuration of the Pipeline
The configuration of each stage the pipeline involves the following tasks.
- Specifying all the flow / statistical methods of the generic analyzer.
- Creation of the event bus.
- Registration of all the available custom analyzers as per the parse graph given.
- Allocation of input queue and connection of the input queue to the I/O module.
- Specification of all the protocols handled in each pipeline stage and distribution of this information to all stages of the pipeline.
- Creation of the I/O queues for the slow path of each of the custom analyzers and for the generic analyzer.
- Configuration of each pipeline stage with the persistence API of the pipeline.
References
- [Mogul1987] Mogul, J., Rashid, R. and Accetta, M., 1987. The packer filter: an efficient mechanism for user-level network code (Vol. 21, No. 5, pp. 39-51). ACM.
- [McCanne1993] McCanne, S. and Jacobson, V., 1993, January. The BSD packet filter: A new architecture for user-level packet capture. In Proceedings of the USENIX Winter 1993 Conference Proceedings on USENIX Winter 1993 Conference Proceedings (pp. 2-2). USENIX Association.
- [TCPDump] http://www.tcpdump.org/
- [LSF] https://www.kernel.org/doc/Documentation/networking/filter.txt
- [Gibb2013] Gibb, G., Varghese, G., Horowitz, M. and McKeown, N., 2013, October. Design principles for packet parsers. In Architectures for Networking and Communications Systems (ANCS), 2013 ACM/IEEE Symposium on (pp. 13-24). IEEE.
- [Attig2011] Attig, M. and Brebner, G., 2011, October. 400 gb/s programmable packet parsing on a single fpga. In Proceedings of the 2011 ACM/IEEE Seventh Symposium on Architectures for Networking and Communications Systems (pp. 12-23). IEEE Computer Society.
- [Kumar2015] Kumar, V., Thiyagarajan, V. and Ramasubramanian, N., 2015, February. A Survey of Packet Classification Tools and Techniques. In Computing Communication Control and Automation (ICCUBEA), 2015 International Conference on (pp. 103-107). IEEE.
- [Tcpdump] www.tcpdump.org
- [Wireshark] www.wireshark.org
- [P4lang] http://p4.org/