Harvested Wood - peteWT/fcat_biomass GitHub Wiki
Climate impact of harvested wood

Key Findings
- Harvested wood in California in 2012 resulted in avoided emissions of 4 MMTCO2e
- Logging residuals not used in bioenergy production contributed emissions of
- XXX MMTCO2e resulting from anthropogenic burning of logging residuals
- XXX MMTCO2e resulting from decomposition of loggin residuals left unburned
- Un-utilized slash from non-commercial management activities on National Forest System lands contributed emissions of XXX MMTCO2e
- Forest Inventory and Analysis re-sample data has been used in the southeast to quantify removals resulting from non-commercial management activity and could be used for this purpose in California
- The Prescribed Fire Information Reporting System (PFIRS) may be a usefull tool in quantifying emissions from pile burns and prescribed fire. However, at this time it is not a requirement for California Air Quality Management Districts to report emissions through this system, and thus it is not comprehensive. It is a requirment that prescribed fires and pile burns on National Forest System Lands are reported through PFIRS. It is not possible at this point to associate burns in PFIRS with commercial harvest activities.
Wood Displacement Factors
Wood harvested from California's forests is used in construction, landscaping and consumer products. In all of its applications, a range of other products can be used in place of wood. For example, in residential construction, precast concrete and structural steel framing are competitive alternatives to wood. The choice of materials used in construction has a profound impact on GHG emissions from the construction sector. This impact can be expressed as a displacement factor (DF). A displacement factor quantifies the amount of emissions reduction achieved per unit of wood used. A meta analysis conducted by Rodger Sathre and Jenifer O'Connor (2010) compared empirical analysis from 21 international studies and found an average emissions reduction of 2.1 tons of carbon (3.9 t CO2e) per ton of dry wood used. Studies ranged substantially around the average, the authors found that the majority of published displacement factors ranged between 1 and 3 tC/t dry wood. The displacement factors published in Sathre and O'Connor (2010) and used in this analysis include the following sources emissions reduction:
- Reduced emissions from manufacturing: Wood products require total energy than than manufacturing most alternative materials.
- Avoided process emissions: Wood-alternatives such as cement have substantial CO2 emissions associated with production.
- Carbon storage in products: Carbon in harvest wood was drawn from the atmosphere through photosynthesis and will remain fixed through the useful life of the wood product.
- Carbon storage in forests: Forests producing wood continue to grow. It is assumed that forests producing wood in California are managed to sustain forest growth (not converted to non-forest land uses).
- Avoided fossil fuel emissions due to bioenergy substitution: Logging and milling residuals used to produce energy avoid emissions from fossil energy sources in the energy sector.
- Carbon dynamics in landfills: A fraction of carbon in wood deposited in landfills post use remains in semi-permanent storage. The remainder is converted to methane through biological decomposition in the landfill. Capture and use of the methane as an energy source, in turn reduces emissions from fossil energy sources.
Displacement Factors Applied to Timber Products Output
To evaluate the climate impact of harvested wood in California I use harvested roundwood estimates from the Timber Products Output (TPO) database. I use two estimates of the DF applied to the harvested wood reported in the TPO based on weather logging residuals are used in bioenergy or left in the woods to decompse or burn.

I use displacement factors reported by Sathre and O'Connor (Table 3) applied to the reported volumes from the TPO. The following references are used to arrive at a displacement factor for harvested roundwood without logging residue utilization.
| reference | displacement factor |
|---|---|
| Eriksson et al. (2007) | 1.7 |
| Eriksson et al. (2007) | 2.2 |
| Salazar and Meil (2009) | 4.9 |
| Werner et al. (2005) | 1.7 |
I use an average of the DF reported here of 2.625 tCO2e/t finished wood product.
For harvested roundwood with logging residue utilization the following studies are used.
| reference | displacement factor |
|---|---|
| Eriksson et al. (2007) | 1.9 |
| Eriksson et al. (2007) | 2.5 |
| Gustavsson et al. (2006) | 4 |
| Gustavsson et al. (2006) | 5.6 |
| Gustavsson et al. (2006) | 2.2 |
| Gustavsson et al. (2006) | 3.3 |
| Pingoud and Perala (2000) | 3.2 |
I use an average of the DF reported here of 3.243 tCO2e/t finished wood product.
TPO is reported in terms of roundwood harvested for products. The displacement factors presented in Sathre and O'Connonr are in terms of tons of finished wood products. Therefore we must assume a milling efficiency to convert TPO estimates to finished wood products. I assume a milling efficiency of 0.5.
Further, TPO is reported in in cubic feet and the DF implies a mass unit. To convert cubic meters to a mass unit we use the average wood density of harvested volume in California weighted by species. Harvest volume by species is reported in McIver and Morgan (Table 4). The resulting weighted average wood density used here is 27.94 lbs/cuft.
McIver and Morgan report the percent of harvest used as bioenergy feedstock. From personal communications with Chelsea McIver, all bioenergy feedstock reported is sourced in-woods (ie, not mill residues).
| year | bioenergy % of harvest | |
|---|---|---|
| 0 | 2000 | 0.024 |
| 1 | 2006 | 0.036 |
| 2 | 2012 | 0.082 |
The TPO reports the total logging residues produced from the states harvest.
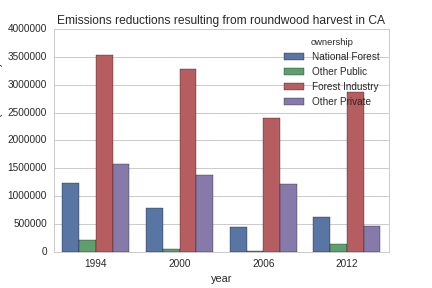
| Ownership | Roundwood Products | Logging Residues | Year | |
|---|---|---|---|---|
| 0 | National Forest | 72.4 | 20.7 | 2012 |
| 1 | Other Public | 16.2 | 3.4 | 2012 |
| 2 | Forest Industry | 328.9 | 72.4 | 2012 |
| 3 | Other Private | 53 | 11.2 | 2012 |
| 4 | National Forest | 52.8 | 16.3 | 2006 |
| 5 | Other Public | 1.1 | 0.3 | 2006 |
| 6 | Forest Industry | 274.3 | 59.6 | 2006 |
| 7 | Other Private | 139.2 | 33.2 | 2006 |
| 8 | National Forest | 90.8 | 22.6 | 2000 |
| 9 | Other Public | 5.2 | 1.6 | 2000 |
| 10 | Forest Industry | 372.5 | 70.6 | 2000 |
| 11 | Other Private | 159.4 | 49.1 | 2000 |
| 12 | National Forest | 132.1 | 11.2 | 1994 |
| 13 | Other Public | 24.7 | 4.3 | 1994 |
| 14 | Forest Industry | 396.1 | 63.1 | 1994 |
| 15 | Other Private | 174.7 | 22.3 | 1994 |
The ratio of harvested volume to which we can apply a displacement factor reflecting bioenergy use of logging residuals can be calculated based on the ratio of reported consumption of logging residuals in bioenergy by McIver and Morgan to the total logging residuals reported in the TPO. McIver and Morgan report bioenergy consumption from 2000 forward. For years previous, we use the average bioenergy consumption from 2000 -- 2012.
To calculate the total emissions reduction resulting from California's timber harvest, we apply the appropriate displacement factor (with or without logging residual utilization) to the commensurate fraction of harvested roundwood. The results are shown in the following chart.
Emissions from un-utilized logging residues
From logging residuals not used in bioenergy, emmisions are produced from combustion of the residual material or from decomposition of the material over time. To calculate the ratio of burned to decompsed logging residues I begin with the CARB estimate of PM2.5 produced from forest management.
Estimate biomass from PM2.5
To estimate total biomass from PM2.5 I assume 90% consumption of biomass in piles and use the relationship of pile tonnage to PM emissions calculated using the Piled Fuels Biomass and Emissions Calculator provided by the Washington State Department of Natural Resources. This calculator is based on the Consume fire behavior model published by the US Forest Service.
| YEAR | EICSOUN | Annual PM 2.5(t) | Biomass (BDT) | |
|---|---|---|---|---|
| 0 | 2000 | FOREST MANAGEMENT | 5474.31 | 901120 |
| 1 | 2005 | FOREST MANAGEMENT | 5474.31 | 901120 |
| 2 | 2010 | FOREST MANAGEMENT | 5474.31 | 901120 |
| 3 | 2012 | FOREST MANAGEMENT | 5477.3 | 901613 |
| 4 | 2015 | FOREST MANAGEMENT | 5480.51 | 902142 |
Total emissions resulting from pile burned forest management residuals can then be derived for the two greenhouse gasses produced from pile burning (CO2, CH4) and from Black Carbon:
| Year | Emissions source | CO2 (t) | CH4 (tCO2e) | BC (tCO2e) | Pile Burn Total (tCO2e) | |
|---|---|---|---|---|---|---|
| 0 | 2000 | FOREST MANAGEMENT | 1.34928e+06 | 127280 | 248255 | 1.72481e+06 |
| 1 | 2005 | FOREST MANAGEMENT | 1.34928e+06 | 127280 | 248255 | 1.72481e+06 |
| 2 | 2010 | FOREST MANAGEMENT | 1.34928e+06 | 127280 | 248255 | 1.72481e+06 |
| 3 | 2012 | FOREST MANAGEMENT | 1.35002e+06 | 127349 | 248391 | 1.72576e+06 |
| 4 | 2015 | FOREST MANAGEMENT | 1.35081e+06 | 127424 | 248536 | 1.72677e+06 |
Emissions from decomposition of un-utilized forest management residuals
Un-utilized residual biomass not consumed in pile burns decomposes over time resulting in emission of methane and carbon dioxide. To provide a full picture of the emissions from residual material produced from commercial timber harvesting in California, decomposition of unutilized logging residuals left on-site that are not burned must be accounted for. To establish the fraction of logging residue that is left to decompose, residues burned and used in bioenergy are subtracted from the total reported by the TPO:
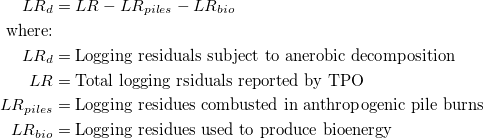
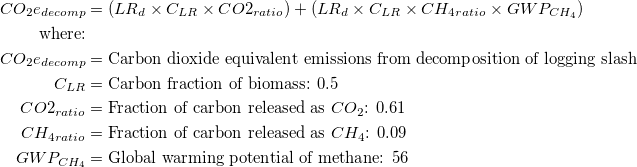
To calculate the GHG emissions from decomposition of piles we use the following equation:
Emissions from non-commercial management residuals
Note: Residues from non-commercial management activities are assumed to be small in comparison with logging residues. In addition, there is presently no empirical data available. As such, estimating these volumes has not been prioritied. I have attempted to provide an estimate for public lands in the National Forest System.
The TPO in California does not report wood volume produced from non-commercial management activities. This includes management activities such as pre-commercial thinning, sanitation thinning, and fuels reduction thinning. To estimate the volume of material produced from these activities we use the following sources:
- Public lands: The USFS Forest Service Activity Tracking System (FACTS) reports management activities conducted on National Forest System Lands. To ensure estimates of biomass volume using FACTS are not duplicative of reported volume in the TPO a series of filters are applied to the FACTS attributes to identify only non-commercial management activities.
- Private industrial timber lands: CalFIRE's Forest Practice Geographical Information System. TODO
Forest Service Activity Tracking System (FACTS)
Data from TPO does not account for forest management activities that do not result in commercial products (timber sales, biomass sales). The USFS reports Hazardous Fuels Treatment (HFT) activities as well as Timber Sales (TS) derived from the FACTS database. I use these two data sets to estimate the number of acres treated that did not produce commercial material (sawlogs or biomass) and where burning was not used. The first step is to eliminate all treatments in the HFT data set that included timber sales. I accomplish this by eliminating all rows in the HFT data set that have identical FACTS_ID fields in the TS dataset. I further filter the HFT dataset by removing any planned but not executed treatments (nbr_units1 >0 below -- nbr_units1 references NBR_UNITS_ACCOMPLISHED in the USFS dataset, see metadata for HFT here), and use text matching in the 'ACTIVITY' and 'METHOD' fields to remove any rows that contain reference to 'burning' or 'fire'. Finally, we remove all rows that that reference 'Biomass' in the method category as it is assumed that this means material was removed for bioenergy.I use a range of 10-35 BDT/acre to convert acres reported in FACTS to volume. The following table presents descriptive statistics for estimates of residual unutilized wood biomass on an annual basis in million cubic feet.
| nf_ncmr | nf_lr | opriv_lr | fi_lr | opub_lr | |
|---|---|---|---|---|---|
| count | 11 | 4 | 4 | 4 | 4 |
| mean | 12.0194 | 17.7 | 28.95 | 66.425 | 2.4 |
| std | 4.68948 | 5.07346 | 16.1593 | 6.07639 | 1.79444 |
| min | 2.37421 | 11.2 | 11.2 | 59.6 | 0.3 |
| 25% | 8.92407 | 15.025 | 19.525 | 62.225 | 1.275 |
| 50% | 13.3557 | 18.5 | 27.75 | 66.85 | 2.5 |
| 75% | 14.5349 | 21.175 | 37.175 | 71.05 | 3.625 |
| max | 17.8532 | 22.6 | 49.1 | 72.4 | 4.3 |
TODO
- Public lands non-commercial management residuals
- Private land non-commercial management residuals
- Public lands logging residuals
- Private lands logging residuals
References
Mciver CP, Meek JP, Scudder MG, Sorenson CB, Morgan TA, Christensen GA. California’s Forest Products Industry and Timber Harvest. Portland, OR; 2012. https://docs.google.com/uc?id=0B9-9Vlx0SkkFRHk5c2czeFR2WTQ&export=download
Sathre R, O’Connor J. Meta-analysis of greenhouse gas displacement factors of wood product substitution. Environ Sci Policy [Internet]. 2010 Apr;13(2):104–14. Available from: https://docs.google.com/uc?id=0B9-9Vlx0SkkFNjVGU0NrTm9HZ3M&export=download
Gustavsson L, Pingoud K, Sathre R. Carbon Dioxide Balance of Wood Substitution: Comparing Concrete- and Wood-Framed Buildings. Mitig Adapt Strateg Glob Chang [Internet]. 2006 May;11(3):667–91. Available from: https://docs.google.com/uc?id=0B9-9Vlx0SkkFMS1Jb2VwV2FfR2M&export=download
Eriksson E, Gillespie AR, Gustavsson L, Langvall O, Olsson M, Sathre R, et al. Integrated carbon analysis of forest management practices and wood substitution. Can J For Res [Internet]. 2007 Mar;37(3):671–81. Available from: https://docs.google.com/uc?id=0B9-9Vlx0SkkFcEduQUozRzVja28&export=download
Pingoud K, Perälä A, Pussinen A. Carbon dynamics in wood products. Mitig Adapt Strateg Glob Chang [Internet]. 2001;6(2):91–111. Available from: http://link.springer.com/article/10.1023/A:1011353806845
Salazar J, Meil J. Prospects for carbon-neutral housing: the influence of greater wood use on the carbon footprint of a single-family residence. J Clean Prod [Internet]. 2009 Nov;17(17):1563–71. Available from: https://docs.google.com/uc?id=0B9-9Vlx0SkkFQTByZEU1eWtHZWs&export=download