Monitoring your python flask web application using prometheus and visualize it in grafana - parthibann/My_wiki GitHub Wiki
Monitoring your python-flask web application using prometheus and visualize it in grafana
Using windows and the following applications for demonstrating this:
- python2.7
- gitbash
- docker for windows
Once all the above is installed, we will create a sample flask web application.
Create a file named "flask_app.py" with the following code
app = Flask(__name__)
@app.route('/welcome/')
def test():
    return 'Welcome'
@app.route('/redirect/')
def test1():
    1/0
    return 'Redirect'
@app.errorhandler(500)
def handle_500(error):
    return str(error), 500
if __name__ == '__main__':
    app.run()
Requests to the application for “/welcome/” receive a text “Welcome” as response, and requests to the application for “/redirect/” cause an exception that results in the 500 Internal Server Error. This in turn is returned as a proper, HTTP 500 response with the error returned as a response text.
We will now modify our application above so that it measures the following two things:
- Number of requests it receives and the response status sent
- Time spent by the server for each request
To accomplish these goals, we will add some more functions,
from flask import request
import time

def start_timer():
    request.start_time = time.time()
def stop_timer(response):
    resp_time = time.time() - request.start_time
    sys.stderr.write("Response time: %ss\n" % resp_time)
    return response
def record_request_data(response):
    sys.stderr.write("Request path: %s Request method: %s Response status: %s\n" %
            (request.path, request.method, response.status_code))
    return response
def setup_metrics(app):
    app.before_request(start_timer)
    # The order here matters since we want stop_timer
    # to be executed first
    app.after_request(record_request_data)
    app.after_request(stop_timer)

if __name__ == '__main__':
    setup_metrics(app)
    app.run()
Now, if we run our web application and make a few requests, we will see the above information being printed like so: Response time: 0.023952245712280273s Request path: /wecome Request method: GET Response status: 301 Response time: 0.0126190185546875s Request path: /redirect/ Request method: GET Response status: 500
Exporting prometheus metrics The Prometheus monitoring system differs from most other similar software in at least one way. Instead of the application pushing metrics to the monitoring system, Prometheus scrapes the application via HTTP usually on the "/metrics" endpoint.
Our next step is to add this endpoint to our web application to expose the calculated metrics in a format understood by Prometheus by using the Promethus Python client.
install prometheus clint using: pip install prometheus_client
import prometheus_client

CONTENT_TYPE_LATEST = str('text/plain; version=0.0.4; charset=utf-8')
@app.route('/metrics/')
def metrics():
    return Response(prometheus_client.generate_latest(), mimetype=CONTENT_TYPE_LATEST)
The generate_latest() function generates the latest metrics and sets the content type to indicate the Prometheus server that we are sending the metrics in text format using the 0.0.4 version.
However, the real work of setting the metrics happens in our middleware module. We have introduced two major changes, the first of which is initializing objects of two metric types:
- Counter
- Histogram
REQUEST_COUNT = prometheus_client.Counter(
    'request_count', 'App Request Count',
    ['app_name', 'method', 'endpoint', 'http_status']
)
REQUEST_LATENCY = prometheus_client.Histogram('request_latency_seconds', 'Request latency',
    ['app_name', 'endpoint']
)
The first argument while creating the objects above is the name of the metric, followed by a description of what it refers to. The third argument is a list of labels associated with the metric.
Then in our functions where we calculated the metrics, we have replaced our earlier sys.stderr.write() statements with the following:
def stop_timer(response):
    resp_time = time.time() - request.start_time
    REQUEST_LATENCY.labels('test_app', request.path).observe(resp_time)
    return response
def record_request_data(response):
    REQUEST_COUNT.labels('test_app', request.method, request.path,
            response.status_code).inc()
    return response
The complete source of sample flask-app:
from flask import Flask, request, Response
import prometheus_client
import time

app = Flask(__name__)
CONTENT_TYPE_LATEST = str('text/plain; version=0.0.4; charset=utf-8')
REQUEST_COUNT = prometheus_client.Counter(
    'request_count', 'App Request Count',
    ['app_name', 'method', 'endpoint', 'http_status']
)
REQUEST_LATENCY = prometheus_client.Histogram('request_latency_seconds', 'Request latency',
    ['app_name', 'endpoint']
)


def start_timer():
    request.start_time = time.time()


def stop_timer(response):
    resp_time = time.time() - request.start_time
    REQUEST_LATENCY.labels('pyprom', request.path).observe(resp_time)
    return response


def record_request_data(response):
    REQUEST_COUNT.labels('pyprom', request.method, request.path,
            response.status_code).inc()
    return response


def setup_metrics(app):
    app.before_request(start_timer)
    # The order here matters since we want stop_timer
    # to be executed first
    app.after_request(record_request_data)
    app.after_request(stop_timer)


@app.route('/welcome/')
def test():
    return 'Welcome'


@app.route('/redirect/')
def test1():
    1/0
    return 'Redirect'


@app.errorhandler(500)
def handle_500(error):
    return str(error), 500


@app.route('/metrics/')
def metrics():
    return Response(prometheus_client.generate_latest(), mimetype=CONTENT_TYPE_LATEST)

if __name__ == '__main__':
    setup_metrics(app)
    app.run()
start the application using 'python flask-app.py' command.
Spinning up the Prometheus server:
1.open git bash command line and pull the prometheus docker image.
docker pull prom/prometheus
- Create a prometheus config file and save it as prometheus.yml.
global:
  scrape_interval: 10s # Set the scrape interval to every 10 seconds. Default is every 1 minute.
# A scrape configuration containing exactly one endpoint to scrape:
  evaluation_interval: 15s
# Here it's Prometheus itself.
scrape_configs:
  - job_name: 'pyprom'
    static_configs:
      - targets: ['localhost:5000']
- Start the prometheus docker image specifying the config folder
winpty docker run -d -p 9090:9090 -v //c/parthiban/prometheus:/etc/prometheus prom/prometheus
In browser open "http://localhost:9090/targets" and check the status of the prometheus app.
now that prometheus is up and running and getting the metrics.
Spinning up the Prometheus server:
- open git bash command line and pull the grafana docker image.
docker pull grafana/grafana
- Start he grafana docker image.
winpty docker run -d -p 3000:3000 grafana/grafana
In browser open "http://localhost:3000/" and login using "admin/admin" credentials.
-
Under configuration -> datasources, create new prometheus datasource specifying the prometheus url "http://localhost:9090"
-
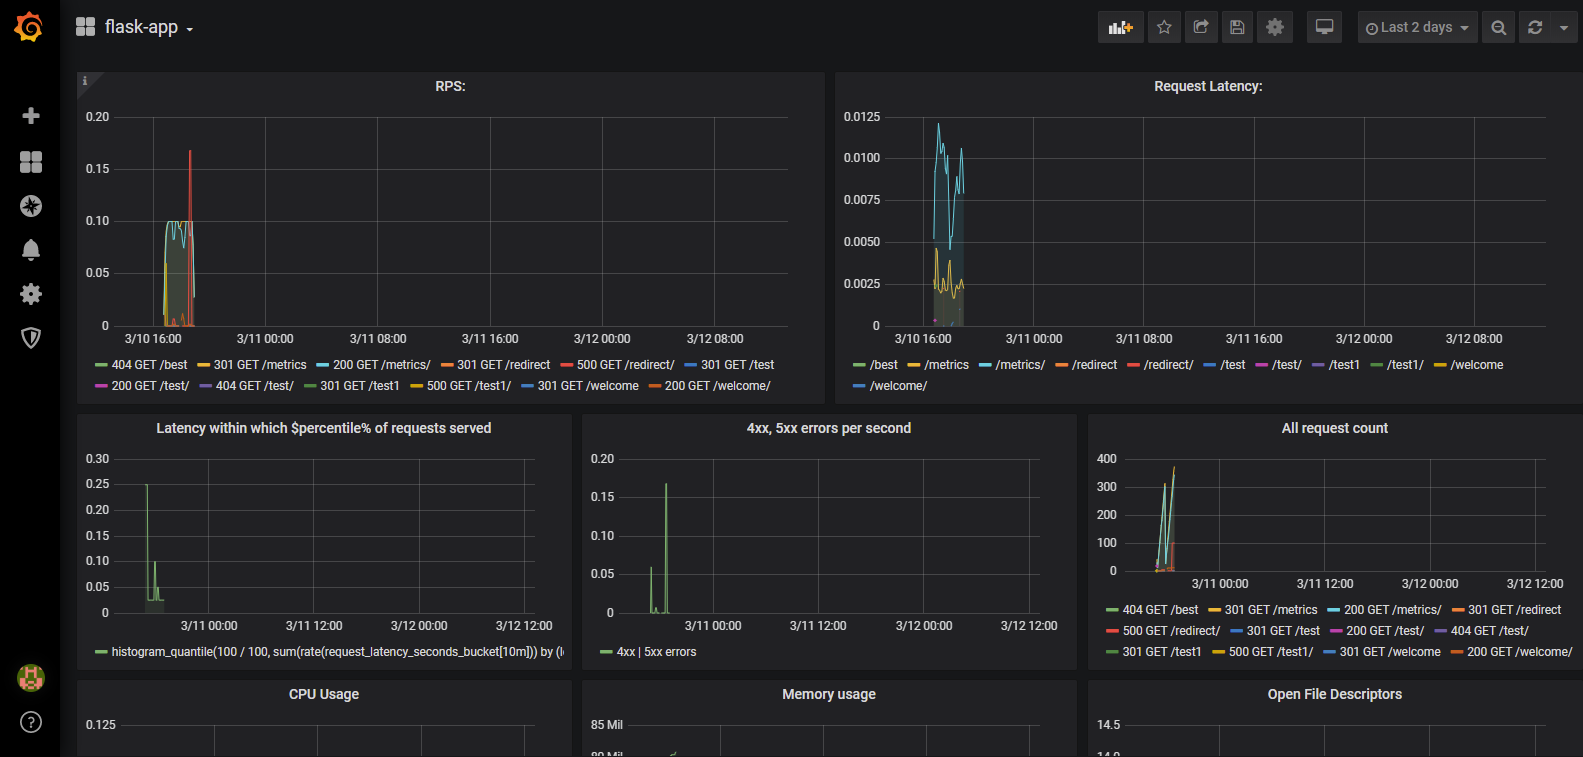
Go to dashboards and create new dashboard and view the results or import the sample json(https://drive.google.com/open?id=1aUhSGr0wtGe_ziqsWqBCk3s4PBaXBwoG) for dashboards.