faq How do I use PadoDesktop to monitor GemFire - padogrid/padogrid GitHub Wiki
How do I use PadoDesktop to monitor GemFire?
Starting Geode/GemFire Cluster with PadoLite Enabled
- Install PadoDesktop and Geode or GemFire.
install_padogrid -product padodesktop
install_padogrid -product gemfire
update_padogrid -product padodesktop
update_padogrid -product gemfire
- Create and start a Geode/GemFire cluster with PadoLite enabled.
create_cluster -product gemfire -type padolite -cluster mygemfire
switch_cluster mygemfire
start_cluster
- Ingest mock data in the cluster.
# Create the default app, perf_test
create_app

# Change directory to perf_test/bin_sh
cd_app perf_test/bin_sh

# Ingest PBM data
test_ingestion -run
test_tx -run

# If you want to view co-located customers and orders data, then
# run 'build_app' to download the javafaker for generating mock data
./build_app

# Ingest customers and orders
./test_group -prop ../etc/group-factory-er.properties -run
- Create and start a PadoDesktop instance.
create_app -app padodesktop -name mydesktop
cd_app mydesktop/bin_sh
./desktop
If the PadoDesktop login dialog displays, then enter any user name. The password is not required.
:pencil2: If you see a blank desktop window after logged in, then select the menu pulldown, File/Open Template. It will reset and refresh the desktop window. When you exit the desktop, PadoDesktop persists your desktop state such that you do not need to take this step again.
Viewing Data in PadoDesktop
PadoDesktop offers many UI plugins for managing Pado clusters. For normal Geode/GemFire clusters, most of these plugins may not be so useful since they are Pado specific. We will limit our discussion to the default Explorer worksheet which applies to any Geode/GemFire clusters.
Physical Path
The left pane in the Explorer tab displays a list of the entire regions defined in the cluster. If you followed the ingestion steps above, then you have ingested the following regions.
| Command | Regions |
|---|---|
| test_ingestion | /eligibility, /profile |
| test_tx | /summary |
| test_group | /nw/customers, /nw/orders |
Click on any of the regions to see their contents.
OQL
You can also execute ad-hoc queries using OQL. Select the OQL tab in the middle pane and enter the following and hit Ctr-Enter.
select * from /nw/customers
:pencil2: The result set size limit is automatically set for each query in order to limit the load that the queries put on the cluster. The default is 1000. You can change the limit using the Limit spinner in the middle pane. The Limit spinner will top off at the maximum limit of 100,000.
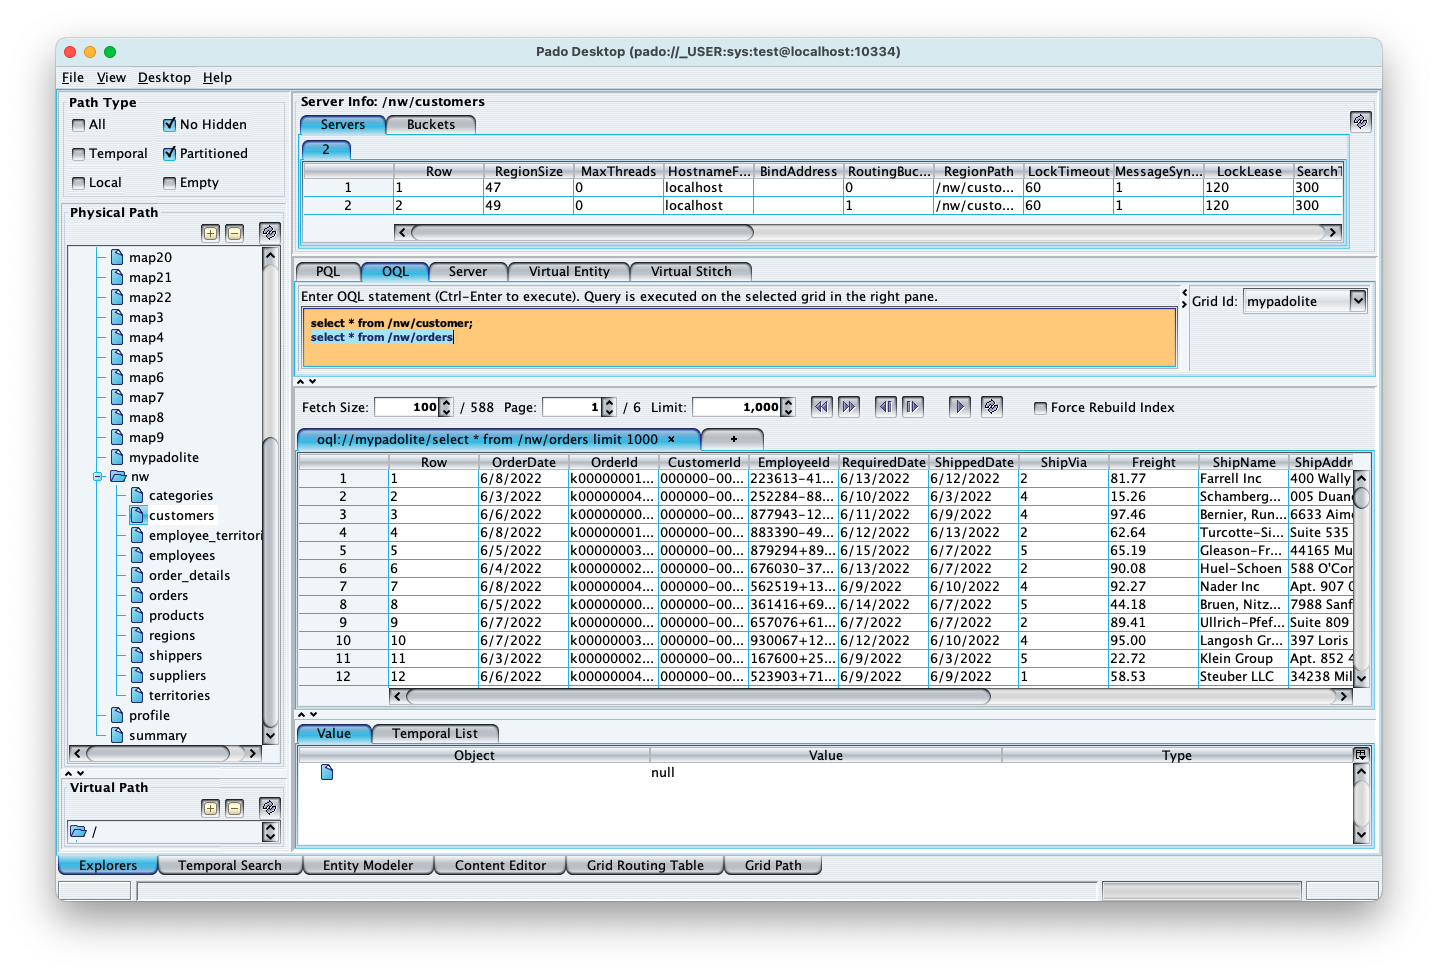
You can also enter multiple queries and select only the one that you want to execute by highlighting the query statement and hit Ctr-Enter as shown in the screenshot below.
Servers
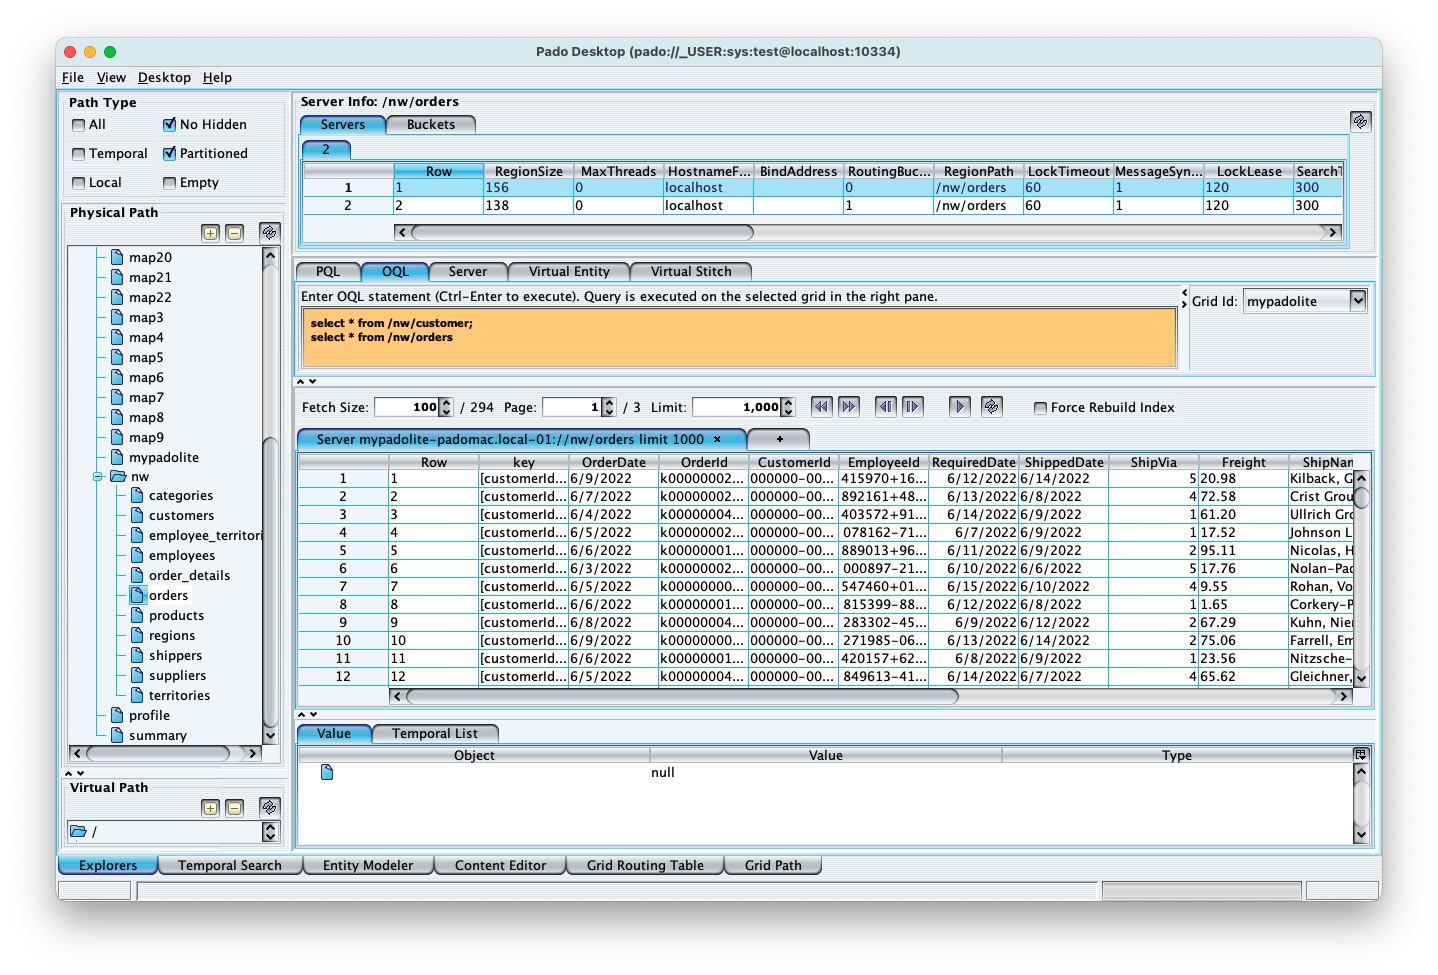
The Server tab in the top pane shows a table of servers. If you select any of the rows then it displays that server's currently selected region contents. If you want to display another region in that server, then select region in the left pane and select the server in the Servers tab once again. You can identify what data you are viewing by looking at the content pane's tab. For our example, it is labeled with Server along with the region path as shown in the screenshot below.
Buckets
Like wise with Servers, you can view data in individual buckets. Select the Buckets tab in the top pane and select any of the bucket rows.
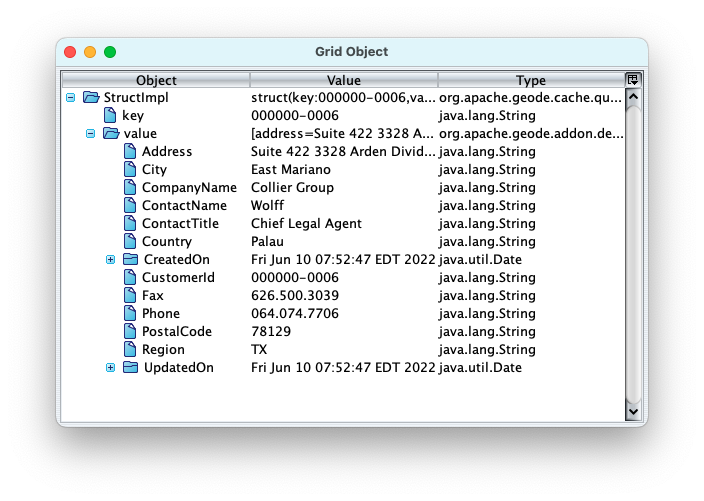
Data Row Selection
You can view each data row in a hierarchical view in the Value tab in the bottom pane by selecting them. You can also view the hierarchical data in the Grid Object Dialog by double clicking on a data row as shown below.