Dependency Graph - overturetool/vdm-vscode GitHub Wiki
A dependency graph represents the dependencies of several objects towards each other. Thus, it is considered as a directed graph where each node points to the node on which it depends. In some cases, you can add some conditions set on the different connections between the nodes. Moreover, each shape represents a node (usually ellipses or circles) and each connector, composed of one or two arrowheads, indicates the direction of the dependencies. You have also the possibility to add labels on connectors to specify the relation between two nodes. To finish, the main usage of a dependency graph consists of describing processes to make it easier for the developer to understand, reuse and maintain his code.
Generating Dependency Graph
In order to generate a dependency graph, you just have to right-click on a file and select VDM > Generate Dependency Graph.
This generates a graphviz file (dependencies.dot) in the project subfolder named .generated/graphviz.
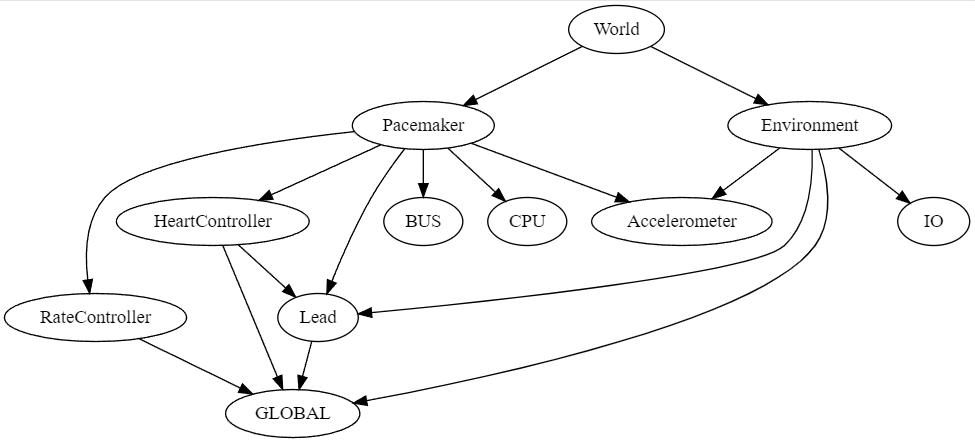
One example of the created file is shown below:
digraph G {
  RateController -> GLOBAL;
  HeartController -> Lead;
  HeartController -> GLOBAL;
  World -> Pacemaker;
  World -> Environment;
  Lead -> GLOBAL;
  Pacemaker -> BUS;
  Pacemaker -> RateController;
  Pacemaker -> Lead;
  Pacemaker -> Accelerometer;
  Pacemaker -> CPU;
  Pacemaker -> HeartController;
  Environment -> IO;
  Environment -> GLOBAL;
  Environment -> Lead;
  Environment -> Accelerometer;
}
Visualising the Dependency Graph
Now that the dependency graph is generated, you can display it thanks to a visualiser, by installing a graphviz extension such as Graphviz for VSCode or Graphviz Interactive Preview.