Run Model from Python - openmpp/openmpp.github.io GitHub Wiki
This example shows how Python can be used to automate modeling, using very general openM++ interfaces. These same interfaces can be used by platforms and applications other than Python with equivalent functionality.
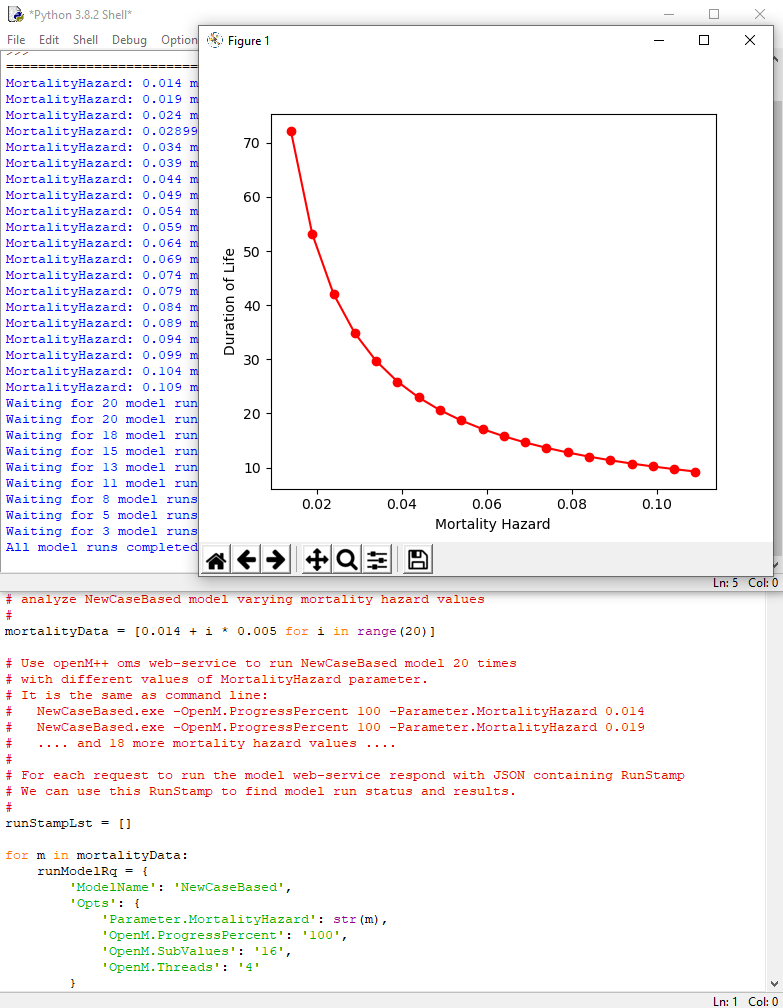
Following Python script is running openM++ "NewCaseBased" test model with 16 subsamples using mortality hazard data:
mortalityData = [0.014 + i * 0.005 for i in range(20)]As result Mortality Hazard increases about eight times in the range of [0.014, 0.109] and we can see eight time decrease of Duration of Life from initial 72 years down to 9 years.
Python example script is using openM++ web-service in order to run the model, modify parameters and read output values.
OpenM++ web-service does not require any installation, just download latest release of openM++,
unpack it into any directory, start oms.exe and run the script:
Windows:
cd C:\my-openmpp-release
bin\ompp_ui.bat
py ompp-python\life_vs_mortality.py
Linux / MacOS:
cd ~/my-openmpp-release
bin/oms
python3 ompp-python/life_vs_mortality.py
As result oms web-service will start to listen incoming requests on http://localhost:4040 and
Python script will do all actions using oms web-service API.
You may also need to install mathplotlib to display the chart and requests to communicate with web-service:
pip install -U matplotlib
pip install requests
Important:
This is an example script and error handling intentionally omitted.
It is highly recommended to use try ... except in production code.
Important:
This is an example script and for simplicity it starts 20 instances of the model simultaneously. Obviously this can work only if model relatively simple. DO NOT USE this in production, please use modeling task instead.

#
# Python integration example using NewCaseBased model:
#   loop over MortalityHazard parameter
#   to analyze DurationOfLife output value

# Prerequisite:
#
# download openM++ release from https://github.com/openmpp/main/releases/latest
# unpack it into any directory
# start oms web-service:
#   Windows:
#     cd C:\my-openmpp-release
#     bin\ompp_ui.bat
#   Linux:
#     cd ~/my-openmpp-release
#     bin/oms
#
# Script below is using openM++ web-service "oms"
# to run the model, modify parameters and read output values.

# Important:
#   Script below starts 20 instances of the model simultaneously.
#   Obviously this can work only if model relatively simple.
#
# DO NOT USE this in production, please use modeling task instead.
#
# Also script below does not handle errors, please use try/except in production.

import time
import requests
import matplotlib.pyplot as plt

# analyze NewCaseBased model varying mortality hazard values
#
mortalityData = [0.014 + i * 0.005 for i in range(20)]

# Use openM++ oms web-service to run NewCaseBased model 20 times
# with different values of MortalityHazard parameter:
#
# NewCaseBased.exe -OpenM.ProgressPercent 100 -OpenM.SubValues 16 OpenM.Threads 4 -Parameter.MortalityHazard 0.014
# NewCaseBased.exe -OpenM.ProgressPercent 100 -OpenM.SubValues 16 OpenM.Threads 4 -Parameter.MortalityHazard 0.019
#   .... and 18 more mortality hazard values ....
#
# For each request to run the model web-service respond with JSON containing RunStamp
# We can use this RunStamp to find model run status and results.
#
runStampLst = []

for m in mortalityData:
    runModelRq = {
        'ModelName': 'NewCaseBased',
        'Opts': {
            'Parameter.MortalityHazard': str(m),
            'OpenM.ProgressPercent': '100',     # reduce amount of progress messages in the log file
            'OpenM.SubValues': '16',            # use 16 sub-values (sub-samples)
            'OpenM.Threads': '4'                # use 4 modeling threads
        }
    }
    #
    # submit request to web-service to run the model
    #
    rsp = requests.post('http://127.0.0.1:4040/api/run', json=runModelRq)
    rsp.raise_for_status()
    js = rsp.json()
    #
    runStamp = js['RunStamp']
    if runStamp is None or runStamp == '':
        raise Exception('Model fail to start, run stamp is empty')
    #
    runStampLst.append(runStamp)
    #
    print("MortalityHazard:", m, "model run stamp:", runStamp)

# wait until all model runs completed
#
n = len(runStampLst)
runDigestLst = ['' for i in range(n)]
done = [False for i in range(n)]

while n > 0:
    print("Waiting for", n, "model runs to be completed...")
    n = 0
    #
    for i in range(len(runStampLst)):
        if done[i]:
            continue    # run already completed
        #
        rsp = requests.get('http://127.0.0.1:4040/api/model/NewCaseBased/run/' + runStampLst[i] + '/status')
        rsp.raise_for_status()
        js = rsp.json()
        runDigestLst[i], status = js['RunDigest'], js['Status']
        #
        if runDigestLst[i] is None or runDigestLst[i] == '' or \
            status is None or status == '' or \
            status in 'i' 'p':  # i = run not started yet, p = run in progress
            #
            n += 1
            continue
        #
        if status == 's':       # success
            done[i] = True
            continue
        #
        raise Exception("Model run failed, run stamp:", runStampLst[i], "status:", status)
        #
    #
    if n > 0:
        time.sleep(1)

# all model runs completed successfully
print("All model runs completed, retrive output values...")

# for each run get output value
#   average duration of life: DurationOfLife.Expr3
#
lifeDurationData = []

for runDigest in runDigestLst:
    rsp = requests.get('http://127.0.0.1:4040/api/model/NewCaseBased/run/' + runDigest + '/table/DurationOfLife/expr')
    rsp.raise_for_status()
    js = rsp.json()
    lifeDurationData.append(js[3]['Value'])

# display the results
#
plt.plot(mortalityData, lifeDurationData, 'ro', ls='-')
plt.xlabel('Mortality Hazard')
plt.ylabel('Duration of Life')
plt.show()