Project plan - nuriagaralon/genome-analysis GitHub Wiki
Leptospirillum ferriphilum is a gram negative chemolithoautotrophic acidophile, a bacteria that lives in acidic, metal-rich environments with mild temperatures, of around 30-40ºC (Christel et al. 2018). This bacteria is an iron oxidiser, which means that it uses ferrous iron (Fe2+) as an electron donor, generating ferric iron (Fe3+); and it can also fixate CO2 as its carbon source (Madigan et al. 2014, Unit 3).
L. ferriphilum's niche is commonly acid drainage from mines, where minerals (FeS2) are exposed to oxygen and Fe2+ is released. This is normally an environmental problem, as the resulting ferric iron reacts with FeS2, creating sulfuric acid (H2SO4) and more Fe2+, which feeds the cycle and severely acidifies the conditions (Madigan et al. 2014, Unit 4). Iron oxidisers can, however, be used for biomining and bioleaching. Approximately 25% of all copper is obtained by bioleaching using iron oxidisers (Madigan et al. 2014, Unit 4), as the reaction needs acidic conditions and produces ferrous iron.
In spite of its importance, there was no complete genome of L. ferriphilum previous to the study by Christel et al., which meant that much of its metabolism and its adaptation to these particular environments was unknown. A complete genome, together with the studying of its transcriptome and proteome, would allow us to study interesting metabolism such as nitrogen fixation, metal resistance, pH homeostasis and oxidative stress management.
This is precisely what Christel et al. set out to do and presented in their article. In addition to whole genome sequencing and de novo genome assembly, they obtained transcriptome data from two types of cultures and analysed the differential expression. These data correspond to three cultures of L. ferriphilum grown in chemostat conditions with Fe2+ and two bioleaching cultures of L. ferriphilum grown in batch on chalcopyrite (CuFeS2).
The aim of this project is to reproduce some of the analyses in Christel et al., excluding those done on the proteome.
To fulfill the aim of the project, two different analyses will be performed. The first one is a de novo genome assembly and annotation, which makes use of genomic data from long-read whole-genome sequencing using PacBio. The fully assembled genome will also be used to infer synteny with a closely-related species. The second analysis is a differential expression analysis, which makes use of paired reads from RNAseq data for the two types of L. ferriphilum cultures.
| Analysis | Software | Expected running time | |
|---|---|---|---|
| 1.1 | Genome assembly | Canu | ~ 11.5h (2 cores) |
| 1.2 | Assembly evaluation | Quast | < 15min (1 core) |
| 1.3 | Assembly evaluation | MUMmerplot | < 5min (1 core) |
| 1.4 | Annotation | Prokka | < 5min (2 cores) |
| 1.5 | Annotation | eggNOGmapper | ~ 1h (HMM algorithm) |
| 1.6 | Synteny comparison* | blastn |
Table 1: Analysis of PacBio DNA raw reads
Synteny comparison might be performed by other software, such as Artemis Comparison Tool (ACT), Circoletto or Satsuma.
| Analysis | Software | Expected running time | |
|---|---|---|---|
| 2.1 | Quality check | FastQC | |
| 2.2 | Reads pre-processing | Trimmomatic | ~ 15min per file, 5 files (2 cores) |
| 2.3 | Quality check | FastQC | |
| 2.4 | Mapping and aligning to assembly | BWA, SAMtools | ~ 5h (2 cores) |
| 2.5 | Read counting | HTSeq | ~ 8h |
| 2.6 | Differential expression analysis | Deseq 2 (R library) |
Table 1: Analysis of Illumina transcriptome raw reads
Additional analyses might be conducted if time allows for it.
In Fig. 1 we can see the workflow for both analyses. The genome assembled from Analysis 1 will be used for mapping the reads from Analysis 2.
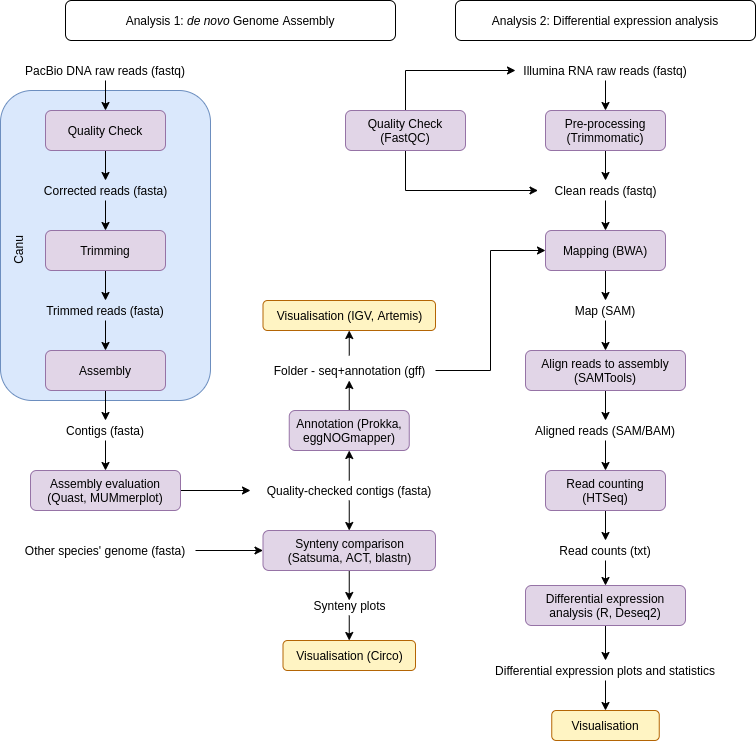
Fig. 1: Input/output workflow diagram. The purple boxes represent actions and the yellow ones visualisation, with the corresponding software in parentheses. The blue box represents one software conducting multiple steps. The text outside of boxes represents the data used for the analyses and its format.
| Analysis | Data | Type | Source | Size |
|---|---|---|---|---|
| 1 | PacBio SMRT cells | DNA, Whole Genome Sequencing | SRA ERP023978 | 2.5GB |
| 2 | Illumina HiSeq2500 | RNA, Transcriptome Sequencing | SRA ERP024141 | 25GB |
Table 3: Data used for the two main analyses in the project.
The raw data and its size when compressed can be found on Table 3. The RNA data corresponds to five sets of paired reads, three from continuous cultures and two from batch cultures grown on chalcopyrite. It is expected that datasets of similar sizes will be generated after certain analyses, for example the trimming of the RNA reads. Thus, it might be necessary to remove some intermediate files after each step.
The original, raw data is kept in the UPPMAX project folder. Other large files generated by the analyses will also be kept at UPPMAX. The smaller outputs, code, log files and so on will be kept in this GitHub repository, which is cloned at UPPMAX and my local computer. As we can see in Fig. 2, each analysis will have its own numeric code, which will be used in related files.
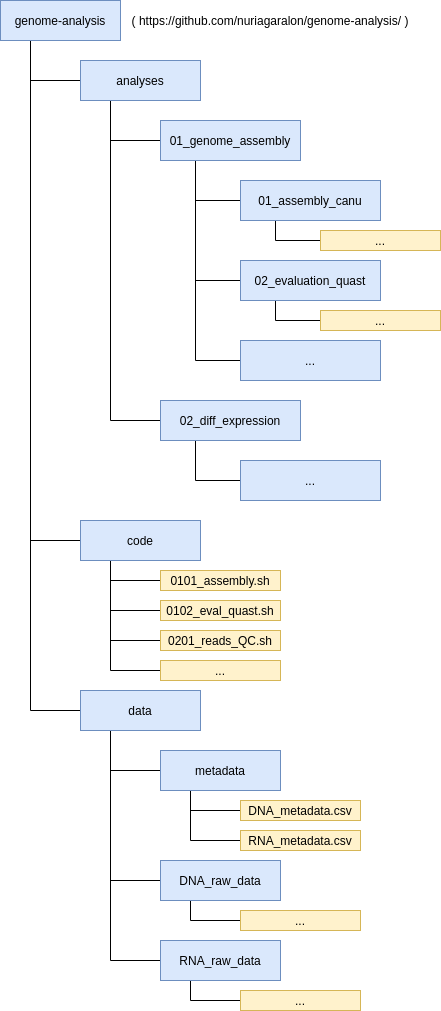
Fig. 2: Data structure of the repository. Directories are represented in blue and files in yellow. The ellipses indicate that not all directories or files are included in the structure.
The initial, tentative time plan can be seen in Fig. 4. Some extra analyses might be conducted if time allows for it.
| Week | Tasks planned | Deadlines |
|---|---|---|
| 23-29/03 | Read and understand article, project plan | |
| 30/03-05/04 | Finish project plan, Assembly (1.1, 1.2, 1.3) | Project plan |
| 06-12/04 | Annotation (1.4, 1.5) and Synteny (1.6) | |
| 13-19/04 | RNAseq pre-processing and quality (2.1, 2.2, 2.3) | Assembly + Annotation |
| 20-26/04 | Mapping and aligning (2.4) | |
| 27/04-03/05 | Read counting (2.5) and diff. expr. analysis (2.6) | Comparative genomics |
| 04-10/05 | Differential expression analysis (2.6) | RNA mapping |
| 11-17/05 | ||
| 18-24/05 | Finish wiki and prepare presentation | |
| 25-31/05 | Final deadline |
Table 4: Initial time plan for the different tasks