EDF Viewer Instructions for Viewing HCHS - nsrr/edf-viewer GitHub Wiki
Requirements
For annotations to display properly in the EDF Viewer MATLAB R2015a or newer must be used. In order to run the executable form of the EDF Viewer, MATLAB Compiler Runtime (MCR) version 8.5 is required.
Download - The MCR is available at http://www.mathworks.com/products/compiler/mcr/ and is approximately 500 Mb
Install - The installation takes around 30 to 45 minutes.
Installing and Using the NSRR Cross Cohort EDF Viewer
Install from compiled version:
- Make sure you have installed the prerequisite 8.5 Matlab Compile Runtime.
- Download the compiled application from: https://github.com/nsrr/edf-viewer
- Unzip the file and place EDF_View.exe in the desired folder.
Install from source code:
- Go to https://github.com/nsrr/edf-viewer
- Download the project and unzip the file
- Select EDF_View.exe to use the program
Getting Started
The workflow for the EDF Viewer is very flexible. In order to use the EDF Viewer to its fullest potential, a new user may follow these steps:
• Loading EDF files with Sleep Portal Viewer
• Navigating EDF files in Sleep Portal Viewer
• Editing Sleep Montages in Sleep Portal Viewer
• Filter Settings and Sensitivity
Loading EDF files with Sleep Portal Viewer
- To view an .edf file, click “Open EDF” and select the desired .edf
- The EDF Header information will be displayed at the top of the window. Signal data is displayed in the lower portion of the window.
- To view annotated events information, you will need the .xml file associated with the .edf file. Click Open XML, then select the .xml file you wish to load.
- Any annotated events will display in the Events pane on the right of the window and tag on corresponding signal channel.
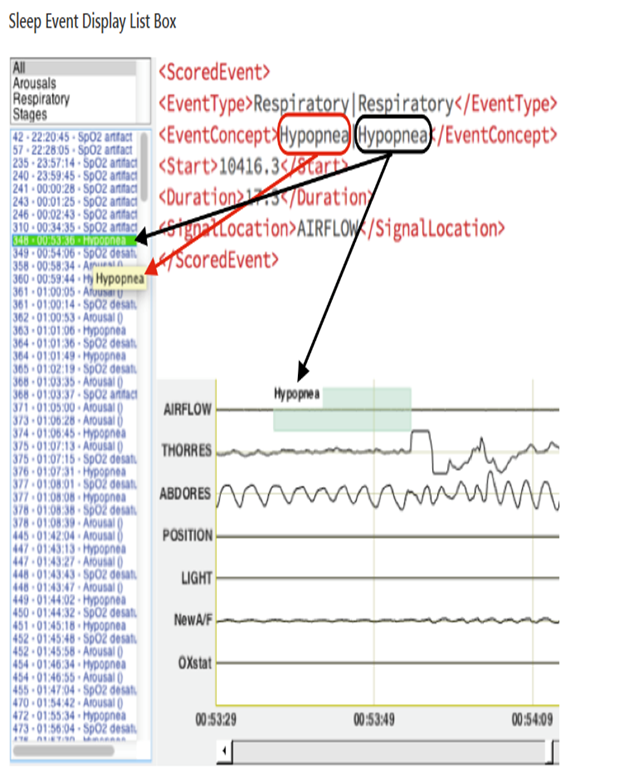
- The Sleep Event Category List Box let you choose event category. When a category is selected in the list box, the Sleep Event List Box will show events of that type. When an event is selected, hover cursor on that event, the Canonical Data Dictionary term will show as a tooltip. The selected event will be highlighted in green color.
XML Annotations
The Sleep Portal Viewer currently only opens up Sleep Annotation Format in XML based on the NSRR Canonical Data Dictionary, provided by datasets, specifically, take a look at the SHHS Annotation File Downloads!
6. The upper middle box (Current Time Window Annotations List box) displays all of the annotations that occur during the current time window.
When selecting an event from the Sleep Event Display Event List box the event will also be highlighted in the Current Time Window Annotations List box. When selecting an event from the Current Time Window Annotations List box, the event will be displayed in the Viewer, but the annotation will not correspond with the annotation highlighted in the Sleep Event Display Event list box.
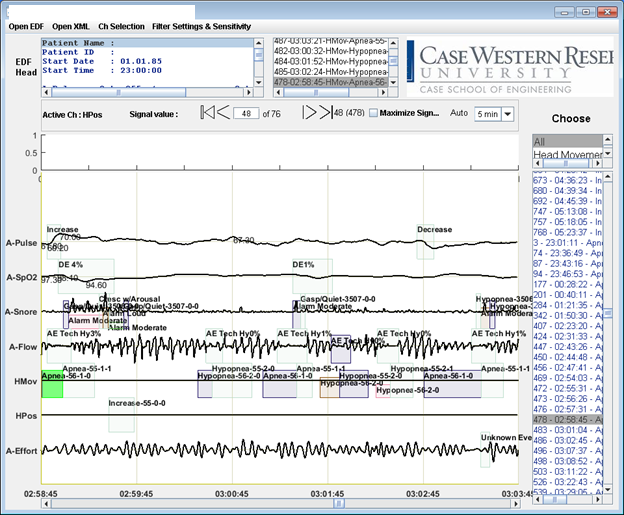
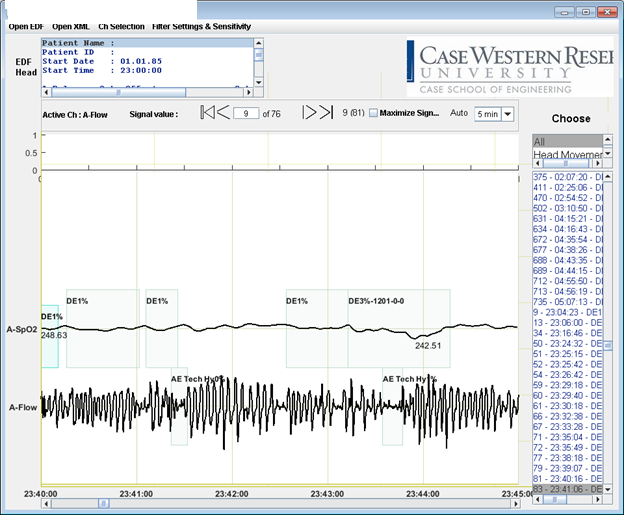
The software used for HCHS created many annotations most of which were computer annotated. Respiratory events which were manually annotated are displayed on the A-Flow channel. These are the only events that are displayed on the A-Flow channel in an attempt to set them apart from the other annotations.
Navigating EDF files in Sleep Portal Viewer
Signal Control Panel
-
You can navigate to any point in the recording by:
o Using the arrow keys to scroll to the next or previous epoch.
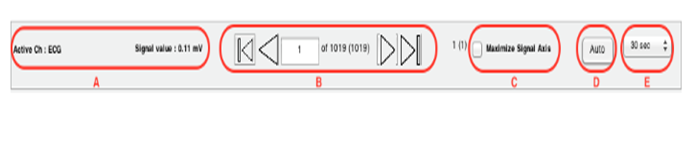
o Clicking the arrow buttons (B)
o Clicking on an event in the Sleep Event Display Event List box or the Current Time Window Annotations List box to jump to its corresponding epoch.
o Using the scroll bar at the bottom of the Channel Data pane. -
The display (A) on the left side of the signal control buttons shows current signal information when clicked on the Channel Data panel.
-
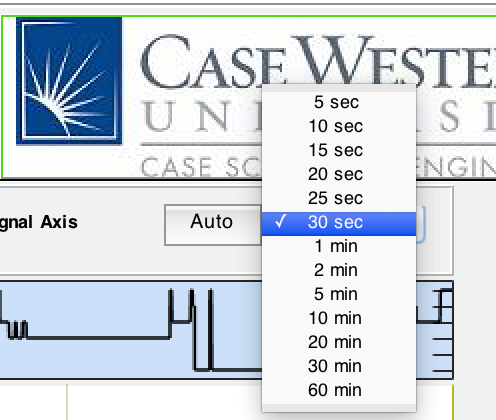
The dropdown menu (E) in the upper right can be used to change the timescale displayed. The epoch length chooser is used to select epoch length to show on the signal display window. The default epoch length is 30 seconds. Users are allowed to choose from 5 seconds up to one hour.
Epoch length chooser -
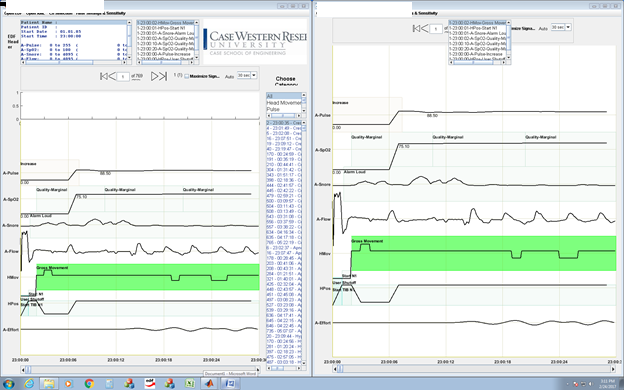
Use the Maximize Signal Axis radio button(C) to toggle the display of the Events pane and increase the viewable size of the Channel Data pane.
Normal View & Maximized Signal View
6. Use Ctrl + arrow keys to scale all channels simultaneously.
7. The Auto button (D) attempts to scale all displayed channels to fit in the Channel Data pane.
Editing Display Montages in Sleep Portal Viewer
Changes to what channels are displayed and their order is edited in the Ch Selection menu. Click on Ch Selection and you will see a listing of all Available Channels on the left and Selected Channels (currently displayed) on the right. Channels are displayed in the order listed in the right pane. Two modes are available to apply montages: Referential Mode and Bipolar Mode. Use Referential Mode to select single channel signals to display as shown below, and use Bipolar Mode to display signal difference. Recommend Referential Mode for HCHS.
****Referential Mode ****
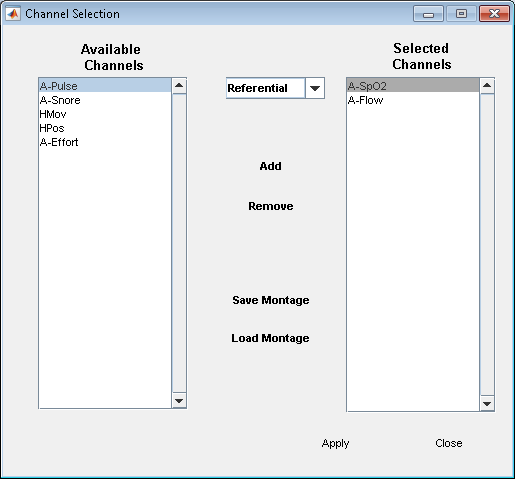
Montage with Referential Mode
To create a new montage:
-
Select each channel to display and click Remove if it is not in the Available Channels pane.
-
Once all channels you wish to use are listed as available begin adding them back to Selected Channels in the order you wish to display them from top to bottom.
-
Once your montage is complete it can be saved or reloaded using the buttons below.
Filter Settings & Sensitivity
The Filter Settings & Sensitivity menu allows you to further change how the raw data is displayed in the Channels Pane. Each displayed signal can be selected and have its display color, sampling rate, and gain adjusted as well as adding high pass, low pass and notch filters. Any changes made to a signal must be applied before selecting another signal or these changes will be lost. All changes to the Channels Pane will be made after clicking Close.
Filter Settings and Sensitivity
