Spectrogram Examples - nsrr/SpectralTrainFig GitHub Wiki
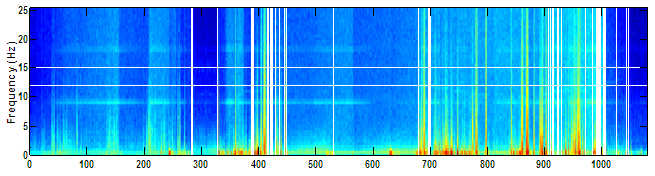
This example of a clean spectrogram shows the expected changes in density associated with natural sleep stage physiology. The increases in density represented by the yellow/orange shift below 2 Hz (delta activity) line up with scored slow wave sleep. The more subtle increases represented by the green/yellow shift between 12-15 Hz (sigma activity) line up with stage 2 sleep and denote an EEG with good sleep spindle density.
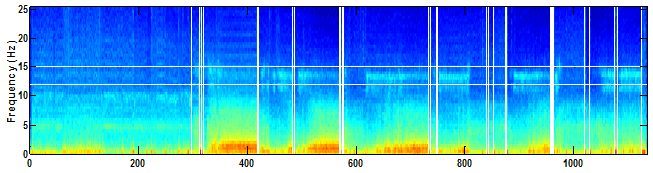
This spectrogram includes a loose/popping EEG lead marked by the abrupt color shifts at epoch 600 when the lead comes loose, 850 when it appears to become partially reattached and epoch 925 when it comes loose again. Electrical artifact introduced by the loose lead can also been seen between epochs 850-925 at 9 and 18 Hz.
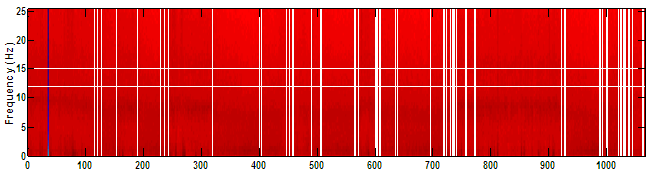
This Red spectrogram is not artifact, but atypical scaling caused by an extremely high amplitude EEG spike existing somewhere in the EDF file. Periods of EEG with amplitudes large enough to cause this effect are not physiological, should not have been scored as sleep, and are generally omitted from results when wake periods are excluded during automatic artifact detection. In this example the location of the spike is marked by the vertical blue stripe at epoch 30.
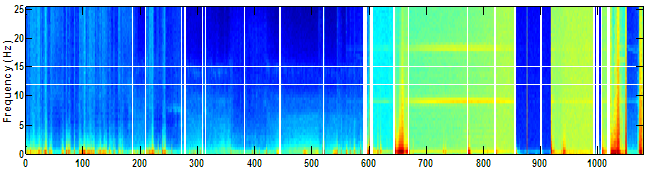
This horizontal striping pattern with wide distribution across the spectrum and subtle variations in frequency is characteristic of ECG artifact. Although this example of pronounced "ECG bleed" can be seen across the majority of the spectrum most results with ECG artifact will be limited to frequencies under 10 Hz.
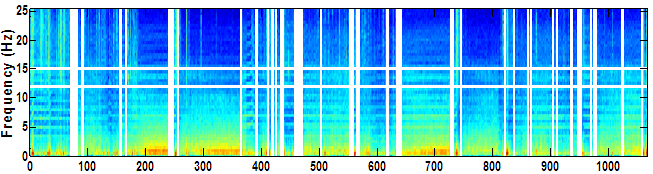
This horizontal striping pattern is similar to ECG artifact but has a more limited distribution at only 9 & 18 Hz, almost no variation in frequency and is indicative of electrical artifact. Due to the specificity in frequency even short periods of electrical artifact should clearly stick out against the spectrogram's background. Electrical interference that "bleeds" in and out or "rides" an otherwise scorable EEG signal will present more subtly (below), while electrical interference introduced through lead popping can be more obvious (example 2 above). In this example the electrical artifact at 9 & 18 Hz would also be clearly visible on the Density Spectra.