SpectralTrainFig Results - nsrr/SpectralTrainFig GitHub Wiki
SpectralTrainFig will export four (or more) files to your results folder per study analyzed and will include the following:
Band.sum.xlsx
Band.sum.xlsx lists spectral power results for each analyzed signal, summarized by frequency bands during total sleep, NREM and REM. The last six columns summarize the artifact count and sleep epochs broken down by total sleep, NREM and REM.
Detail.spectral.xlsx
Detail.spectral.xlsx contains a detailed breakdown of each analyzed signal and lists its power and power density values for each 0.5sec bin on an epoch by epoch basis. The last six columns list which epochs were flagged as sleep (NREM or REM) and artifact (delta or beta).
Total.power.xlsx
Total.power.xlsx gives total power density results for each signal analyzed, broken down into total sleep, NREM and REM summaries. Each signal summarized will include: Power (zero top), Power, Power Density, log10 Power (zero top), log10 Power, and log10 Power Density.
Spectral.pt
This PowerPoint presentation provides a visual summary of spectral results and is the primary file used in adjudication. It includes visual representations for each signal including: title card, artifact detection summaries, the EEG power density spectrogram, density spectra, hypnogram and the log10 density by band in each bin of interest (details below.)
Spectral.pt Contents
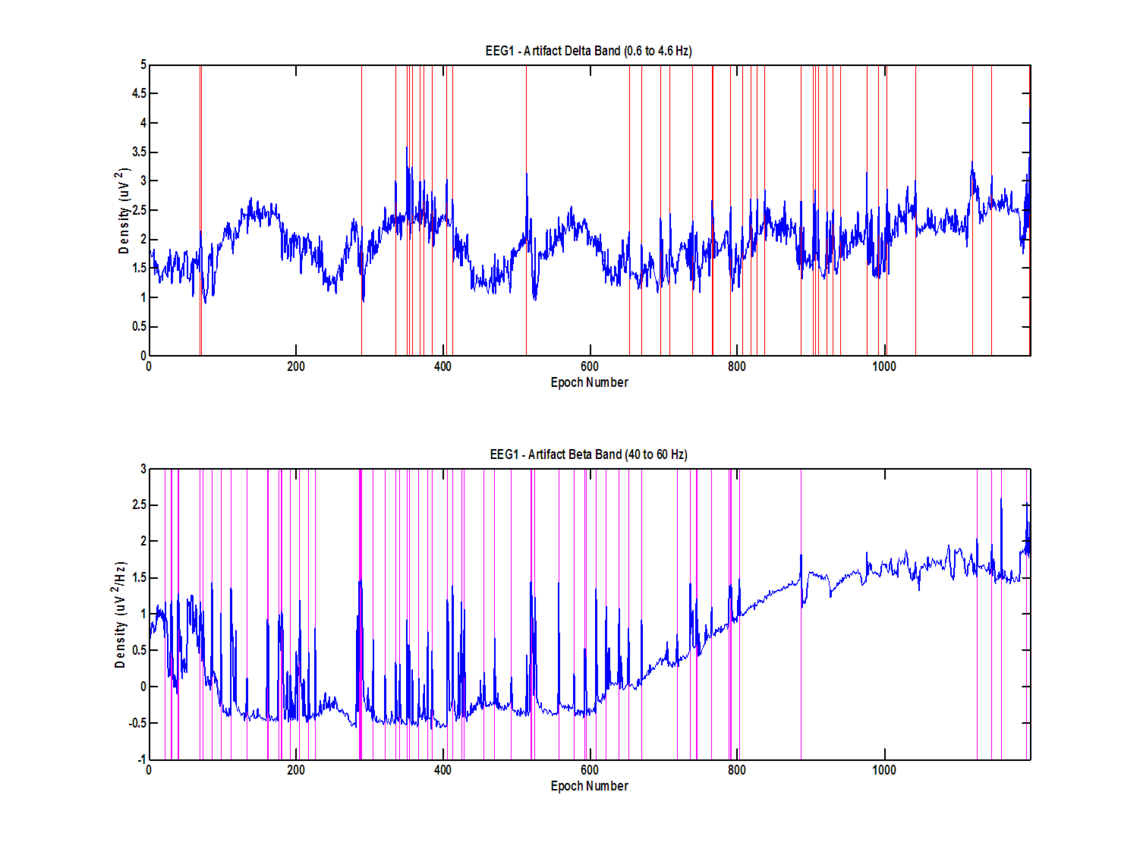
Artifact Detection Summaries (pg. 2)
The second slide in Spectral.pt diplays EEG power density in the bins of interest for artifact detection, delta (0.6-4.6Hz) and beta (40-60Hz). Each vertical marker represents an epoch rejected from analysis due to a sub-epoch in which EEG amplitudes exceeded a running average of EEG amplitudes by greater than the Artifact Detection threshold set in SpectralTrainFig's Analysis Parameters (default thresholds of 2.5x and 2x respectively).
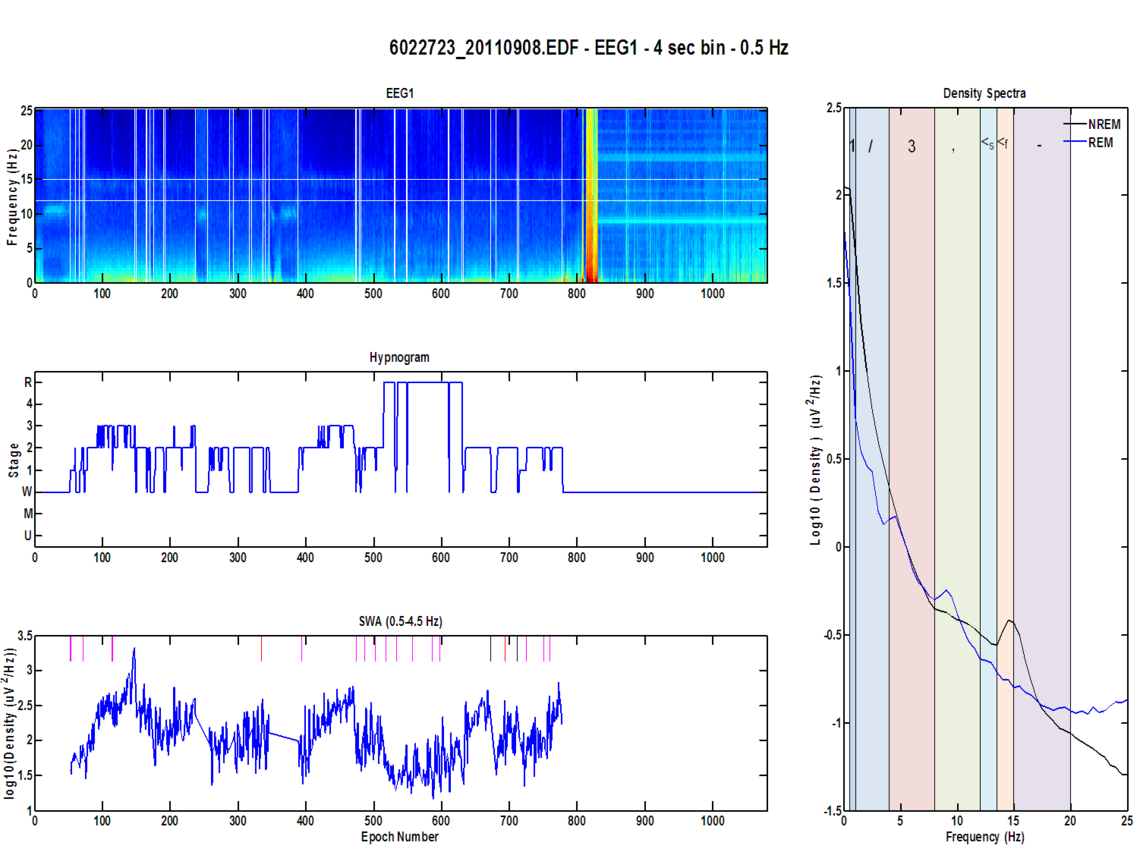
Spectral Adjudication Summary (pg. 4)
The Spectral Adjuducation Summary slide was designed by EEG experts working together with SpectralTrainFig’s developer to aid in visual review of spectral analysis results, and is a combination of slides 3 and 5. It contains the EEG Power Density Spectrogram, Hypnogram, Density Spectra, and SWA log10 Density for the analyzed EEG derivation. The Density Spectra displays overall frequency power distributions for the current lead, while the spectrogram shows this data as a function of time. The SWA plot displays the log10 density in the 0.5-4.5 Hz range to review slow wave activity for artifact. A standard hypnogram provides quick visual reference of sleep staging for comparison to the spectrogram and SWA plots. The information in these four charts can be used for reasonably comprehensive results adjudication without the need to examine the raw EEG data.
Log10 Density by Band (pgs. 6-13)
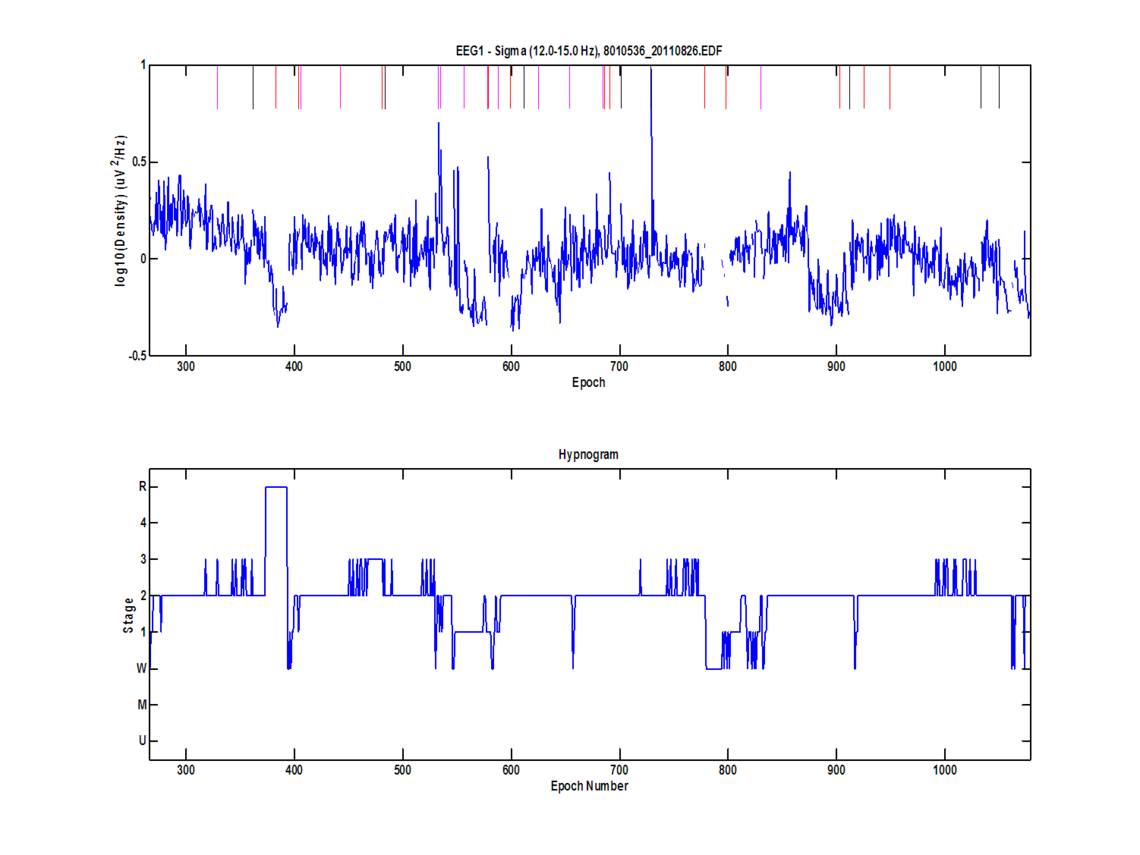
Slides 6-13 break down the recorded lead’s power density over the eight bands of interest: slow oscillations, delta, theta, alpha, overall sigma, fast sigma, slow sigma and beta. Each slide includes a band’s log10 power density as a function of time with vertical marks denoting delta (red) and beta (pink) artifacts and a hypnogram for comparison. Below is an example of a ppt's sigma (12-15 Hz) power density.