Density Spectra Examples - nsrr/SpectralTrainFig GitHub Wiki
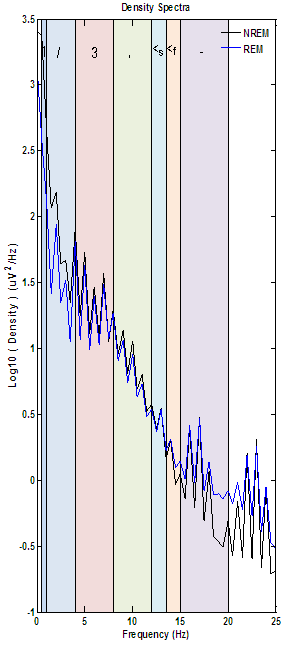
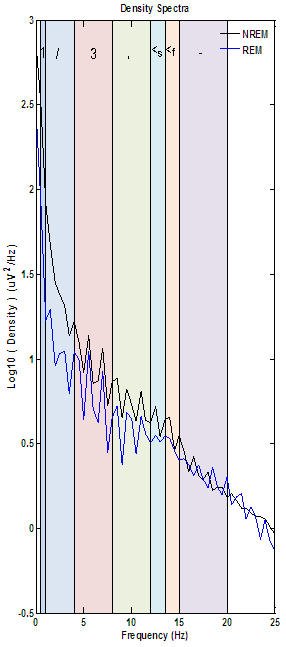
The density spectra below is a good example of clean spectral results from a ppt having a healthy sleep architecture.
- Both NREM and REM results share a similar overall curve.
- Both plots also share logical density values on either end of the spectrum where higher values would be indicative of excessive low or high frequency artifact.
- The largest variation between NREM and REM is the expected reduction in sleep spindle (12-15 Hz) density during REM. Not all results will display good spindle density, but the majority will show an increases in density in the 4-8 Hz range caused by theta activity seen in stages 1, 2 & 3 (and sometimes REM, like the example below.)
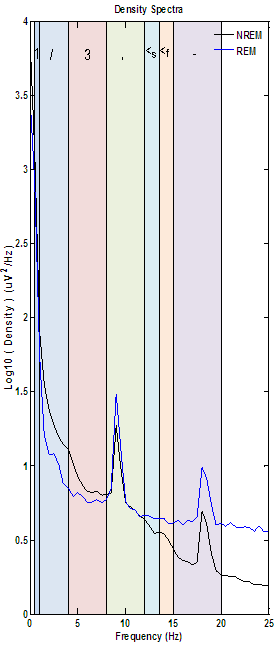
The density spectra below is an example of how electrical interference will present in spectral results. While the density spectra has two plots sharing similar curves with logical density values on either end of the spectrum (like the above example) there is still clear evidence of artifact.
-
Sharpness of the spikes seen, which are indicative of a signal frequency with very little variation as opposed to true physiological activity (which will have some variation) which results in rounded humps instead of sharp spikes.
-
Distribution of spikes at frequencies that are multiples of the slowest spike, in this case 9 Hz and 18 Hz.
- Electrical artifact from a "clean" 50 or 60 Hz power source should not show up on the density spectra or spectrogram because spikes would be far outside the range of interest (0.5-20 Hz).
- In practice an electrical signal will frequently be composed of harmonic components that are multiples of one another based on a signal's sampling rate and fundamental frequency (ex. spikes at 9/18/27, 8/16/24 or 5/10/15/20/25 Hz.)
-
The final indicator of possible artifact is the lack of variation between NREM and REM results.
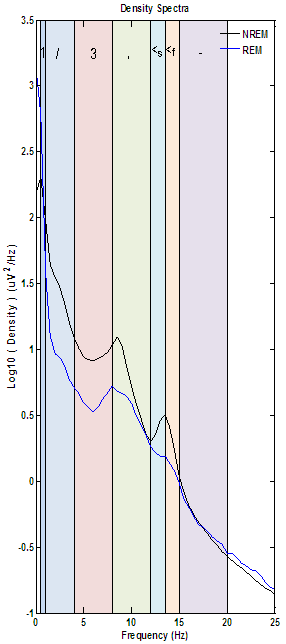
The density spectra below is indicative of a study with excessive, low frequency artifact. This slow wave artifact cannot be confirmed from the density spectra alone, but the total lack of the density increases in the theta and sigma bands assosciated with normal sleep physiolgy should be cause for further investigation of the resulting spectrogram, hypnogram and SWA density plot.
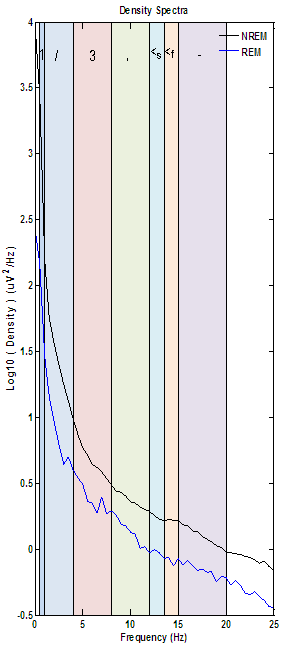
The example below has been assosciated with studies with pronounced ECG artifact. It is not uncommon for many EDFs to contain some degree of ECG "bleed" but excessive ECG artifact will begin to dramatically alter the density spectra. While ECG artifact can cover the entire spectrum like the example below it is most commonly seen in the <10 Hz range. The most common variation between NREM and REM plots containing ECG artifact is ECG artifact exclusive to the REM plot. This is due to the nature of REM sleep atonia allowing previously subtle ECG bleed to become more pronounced.
This final density spectra is an example of a study containing both ECG and electrical artifact. ECG is responsible for the wide distribution of smaller spikes while the electrical component causes these spikes to cluster around multiples of the electrical source's fundamental frequency with a waxing/waning pattern. While it is not obvious below these spikes are clustering around electrical artifact at 8, 16 and 24 Hz.