PLDI Tutorial - nsg-ethz/SDNRacer GitHub Wiki
Artifact for PLDI '16 paper #274: SDNRacer: Concurrency Analysis for Software-Defined Networks
Downloads: the artifact VM, the paper.
Note: The tool is now called SDNRacer.
SDNRacer
In only few years, Software-Defined Networking (SDN) has managed to impose itself as the new way to design and operate computer networks. While the premises of SDN are simple, realizing this vision relies on the ability of developers to build highly sophisticated and reliable SDN control software operating on top of a network: a highly asynchronous and distributed environment. Building such highly asynchronous programs is known to be a very difficult problem due to inadvertently introducing harmful errors. In particular, concurrency violations are an important source of bugs in SDNs, often leading to policy or invariant violations such as blackholes, forwarding loops or non-deterministic forwarding.
We present SDNRacer, the first comprehensive dynamic and controller-agnostic concurrency analyzer for production-grade SDNs aimed to discover concurrency violation that are notoriously difficult to avoid, detect and debug. SDNRacer checks for a variety of errors including: (high-level) data races, per-packet consistency, and update consistency.
This artifact is divided into three primary sections. The first section provides overview of the artifact contents and a quick guide to reproducing the results in our paper. In the second part, we offer more detailed instructions on how to run SDNRacer on a particular network trace and how to interpret the analysis results. In section three we show how to use the instrumented version of STS and different controllers to produce new network traces. Finally, for completeness in Appendix A and Appendix B we discuss important aspects of our implementation and custom installation of SDNRacer from source respectively.
Section 1: Artifact and Reproducing the results
Artifact contents
- A VM in OVA 2.0 format, suitable for use with VirtualBox. Username/password are both "sdnracer". Information on how the VM was setup is provided at the end of this document.
- STS/SDNRacer (
hb_graph.py). - All traces, configurations, and scripts used to generate the results from the paper.
- A script to easily reproduce all results from Table 2 and the figures in the paper (runtime ~3 hours).
- Instrumented versions of POX and Floodlight controllers, and scripts to generate new traces that use these controllers.
- All source code is included in the artifact, however it may also be viewed directly on Github:
- SDNRacer: https://github.com/jmiserez/sts (branch hb)
- POX: https://github.com/jmiserez/pox (branches hb, eel-hb)
- Floodlight: https://github.com/jmiserez/floodlight (branch hb)
- ONOS: https://github.com/jmiserez/onos (branch hb)
- ONOS App Samples: https://github.com/jmiserez/onos-app-samples (branch hb)
- Trace files: https://github.com/jmiserez/sdnracer-traces (branch artifact)
Quick Start: Using the tool
To help automate the process, we provided three scripts to reproduce our expirements in quick way. Doing the same manually is explained the next sections.
- Setup the VM, user/pass is "sdnracer".
- On the desktop of the VM, there are a number of howto scripts that explain different scenarios:
01_run_sdnracer_on_a_single_trace.shinvokes SDNRacer to analyze one of the provided traces. Explained in Section 2.02_reproduce_all_paper_results.sh(takes about 2-3 hours to run, coffee break) reproduces the numbers from table 2 in the paper.03_generate_a_new_random_trace.shgenerates a new network trace using our instrumented version of STS and an instrumented controller. Explained in Section 3.
Comparing the results
After running 02_reproduce_all_paper_results.sh (takes 2-3 hours), SDNRacer will analyze all the traces. 02_reproduce_all_paper_results.sh invokes some additional scripts to gather the results from all the runs and present them in a nicer way.
- Table 2: The main results, reported in Table 2 in the paper, are saved to
/home/sdnracer/Desktop/sdnracer/sdnracer-traces/data/total_table.csv. This file contains a little more details than presented in our paper. Particularly, is shows the exact number of covered races, while in the paper we just state the best case at the end of Section 8.2 (2.4% for ONOS forwarding application on Single-Topology). Note the numbers changed in 3 cases out of the 29 cases for update isolation property and 8 cases out of the 29 cases for number of updates. - Figure 4: Reports the effectiveness of our filter. This figure saved at
/home/sdnracer/Desktop/sdnracer/sdnracer-traces/figures/fig4_filter_cmp_cdf.pdf - Figure 5: Report5 the effectiveness HB time rule. This figure saved at
/home/sdnracer/Desktop/sdnracer/sdnracer-traces/figures/fig5_time_cdf.pdf - Figure 6: Report the runtime SDNRacer takes to analyze traces:
/home/sdnracer/Desktop/sdnracer/sdnracer-traces/figures/fig5_time_cdf.pdf. Note: because benchmarking is a specific to the machine, we included the benchmark results from the specific machine we used at/home/sdnracer/Desktop/sdnracer/sdnracer-traces/benchmark_data/and this is what is plotted. Also, note our results are faster than the paper (we will update the camera ready) since we did some optimization in our code (primarily serialization/deserialization and memory management). If the reviewer is interested in running the benchmark code locally they can invoke the following (it will take few hours)cd /home/sdnracer/Desktop/sdnracer/sdnracer-traces/; benchmark.sh
Additionally in the paper we discoverd two update isolation violations. These results can be reproduced as follows:
- Violation 1 In Floodlight This violation can be reproduced using:
cd ~/Desktop/sdnracer/sts/
./sts/happensbefore/hb_graph.py --data-dep ../sdnracer-traces/trace_floodlight_loadbalancer-StarTopology4-steps200/hb.json
SDNRacer extract a subgraph of the HB relations that point directly to the violation (for ease of use). This subgraph can be visualized using:
xdot ~/Desktop/sdnracer/sdnracer-traces/trace_floodlight_loadbalancer-StarTopology4-steps200/isolation_violation_100.dot
Looking the subgraph, you will notice that Floodlight is receiving two unordered PacketIn events for the same destination. However, Floodlight responds to the PacketIn events by issuing two different unordered writes (FlowMod events) and each one of these writes send the packet to a different port (visualized as ofp_action_output(port=?) in the graph).
- Violation 2 In POX, this case is explained in more detail in Section 2. This a quick way to reproduce it.
This violation can be reproduced using:
cd ~/Desktop/sdnracer/sts
./sts/happensbefore/hb_graph.py ~/sdnracer-traces/trace_pox_eel_l2_multi-MeshTopology2-steps200/hb.json --data-dep
xdot ~/Desktop/sdnracer/sdnracer-traces/trace_pox_eel_l2_multi-MeshTopology2-steps200/isolation_violation_0.dot
Section 2: Running SDN Racer:
In this section will walk through the process of using SDNRacer to analyze a trace produced by the modified version of STS. We start with a brief overview of the application we used to demonstrate SDNRacer capabilities, and then we show how to run SDNRacer to analyze the trace produced by this application, and we give an overview of the output produced by SDNRacer. Finally, we show how the controller developer will use this analysis to fix consistency related bugs.
We picked the POX EEL forwarding application,
trace_pox_eel_l2_multi-MeshTopology2-steps200 , as our showcase example. This particular trace is shown in Table 2 in the paper under "Forwarding -> Linear -> POX EEL". The same procedure can be used to analyze any other network trace.
Brief Overview of the Forwarding Application
The Forwarding application is essentially an optimized learning switch application. The Forwarding application does two primary jobs (i) proactively learn the topology of the network and (ii) reactively install forwarding rules for hosts trying to communicate over the network.
POX is shipped with an implementation of the Forwarding application, called l2_multi. This application takes advantage of the OpenFlow discovery module; which discovers the topology of the network using Link Layer Discovery Protocol (LLDP). The Discovery module injects LLDP packets regularly in the data-plane to discover the topology of the network -- the topology is represented as a graph in the controller. However, LLDP is designed to discover switches and links between them, but not end hosts connected the network. The Forwarding application only learns about end hosts when the host first sends a packet to the network. Then l2_multi records the location of the host, location is the switch and switch port, in the graph. If an end host is trying to communicate to a host that has not been discovered yet, l2_multi will flood the network until it is found. If the controller already learned the location of the packet destination, it installs the entire forwarding path for the packet before sending it back to the original switch. When the network changes, for instance, a new link is discovered, the forwarding application will delete all the previously installed rules and recomputes the network paths.
For this example, we will run the Forwarding application on top of a simple network topology with two switches and two hosts. This particular trace is located at
~/Desktop/sdnracer/sdnracer-traces/trace_pox_eel_l2_multi-MeshTopology2-steps200
The trace folder should contain a file called hb.json. This file captures the events in the traces and the HB relations among them.
Invoking SDNRacer:
We will invoked SDNRacer with it's default arguments,
for more detailed documentation about SDNRacer parameters cd ~/Desktop/sdnracer/sts; ./sts/happensbefore/hb_graph.py -h.
cd ~/Desktop/sdnracer/sts
./sts/happensbefore/hb_graph.py ~/sdnracer-traces/trace_pox_eel_l2_multi-MeshTopology2-steps200/hb.json --data-dep
The output of this comnmand is as follows:
~/Desktop/sdnracer/sts$ ./sts/happensbefore/hb_graph.py ~/Desktop/sdnracer/sdnracer-traces/trace_pox_eel_l2_multi-MeshTopology2-steps200/hb.json --data-dep
Read 320 events.
Added 306 events.
Total write operations: 20
Total read operations: 50
Processing 190 w/w combinations
Updating has_path path cache...
10%
20%
30%
40%
50%
60%
70%
80%
90%
100%
Processing 1000 r/w combinations
10%
20%
30%
40%
50%
60%
70%
80%
90%
100%
Updating has_path path cache...
Saving HB graph to: /home/sdnracer/Desktop/sdnracer/sdnracer-traces/trace_pox_eel_l2_multi-MeshTopology2-steps200/hb.dot
Storing packet incoherent for 12:34:56:78:01:02->12:34:56:78:02:02 in /home/sdnracer/Desktop/sdnracer/sdnracer-traces/trace_pox_eel_l2_multi-MeshTopology2-steps200/incoherent_12:34:56:78:01:02_12:34:56:78:02:02_315.dot
Storing packet incoherent for 12:34:56:78:02:02->12:34:56:78:01:02 in /home/sdnracer/Desktop/sdnracer/sdnracer-traces/trace_pox_eel_l2_multi-MeshTopology2-steps200/incoherent_12:34:56:78:02:02_12:34:56:78:01:02_363.dot
Storing packet incoherent for 12:34:56:78:01:02->12:34:56:78:02:02 in /home/sdnracer/Desktop/sdnracer/sdnracer-traces/trace_pox_eel_l2_multi-MeshTopology2-steps200/incoherent_12:34:56:78:01:02_12:34:56:78:02:02_503.dot
Storing packet incoherent for 12:34:56:78:02:02->12:34:56:78:01:02 in /home/sdnracer/Desktop/sdnracer/sdnracer-traces/trace_pox_eel_l2_multi-MeshTopology2-steps200/incoherent_12:34:56:78:02:02_12:34:56:78:01:02_515.dot
Storing packet incoherent for 12:34:56:78:02:02->12:34:56:78:01:02 in /home/sdnracer/Desktop/sdnracer/sdnracer-traces/trace_pox_eel_l2_multi-MeshTopology2-steps200/incoherent_12:34:56:78:02:02_12:34:56:78:01:02_672.dot
Storing packet incoherent for 12:34:56:78:01:02->12:34:56:78:02:02 in /home/sdnracer/Desktop/sdnracer/sdnracer-traces/trace_pox_eel_l2_multi-MeshTopology2-steps200/incoherent_12:34:56:78:01:02_12:34:56:78:02:02_739.dot
Storing packet incoherent for 12:34:56:78:02:02->12:34:56:78:01:02 in /home/sdnracer/Desktop/sdnracer/sdnracer-traces/trace_pox_eel_l2_multi-MeshTopology2-steps200/incoherent_12:34:56:78:02:02_12:34:56:78:01:02_781.dot
Storing packet incoherent_remaining for 12:34:56:78:01:02->12:34:56:78:02:02 in /home/sdnracer/Desktop/sdnracer/sdnracer-traces/trace_pox_eel_l2_multi-MeshTopology2-steps200/incoherent_remaining_12:34:56:78:01:02_12:34:56:78:02:02_315.dot
Storing packet incoherent_remaining for 12:34:56:78:02:02->12:34:56:78:01:02 in /home/sdnracer/Desktop/sdnracer/sdnracer-traces/trace_pox_eel_l2_multi-MeshTopology2-steps200/incoherent_remaining_12:34:56:78:02:02_12:34:56:78:01:02_363.dot
Storing packet incoherent_remaining for 12:34:56:78:01:02->12:34:56:78:02:02 in /home/sdnracer/Desktop/sdnracer/sdnracer-traces/trace_pox_eel_l2_multi-MeshTopology2-steps200/incoherent_remaining_12:34:56:78:01:02_12:34:56:78:02:02_503.dot
Storing packet incoherent_remaining for 12:34:56:78:02:02->12:34:56:78:01:02 in /home/sdnracer/Desktop/sdnracer/sdnracer-traces/trace_pox_eel_l2_multi-MeshTopology2-steps200/incoherent_remaining_12:34:56:78:02:02_12:34:56:78:01:02_515.dot
Storing packet incoherent_remaining for 12:34:56:78:02:02->12:34:56:78:01:02 in /home/sdnracer/Desktop/sdnracer/sdnracer-traces/trace_pox_eel_l2_multi-MeshTopology2-steps200/incoherent_remaining_12:34:56:78:02:02_12:34:56:78:01:02_781.dot
Storing packet covered for 12:34:56:78:02:02->12:34:56:78:01:02 in /home/sdnracer/Desktop/sdnracer/sdnracer-traces/trace_pox_eel_l2_multi-MeshTopology2-steps200/covered_12:34:56:78:02:02_12:34:56:78:01:02_672.dot
Storing packet covered for 12:34:56:78:01:02->12:34:56:78:02:02 in /home/sdnracer/Desktop/sdnracer/sdnracer-traces/trace_pox_eel_l2_multi-MeshTopology2-steps200/covered_12:34:56:78:01:02_12:34:56:78:02:02_739.dot
Saving all races graph in just_races.dot
######## Update isolation violations ########
Saving update isolation violation graph to /home/sdnracer/Desktop/sdnracer/sdnracer-traces/trace_pox_eel_l2_multi-MeshTopology2-steps200/isolation_violation_0.dot
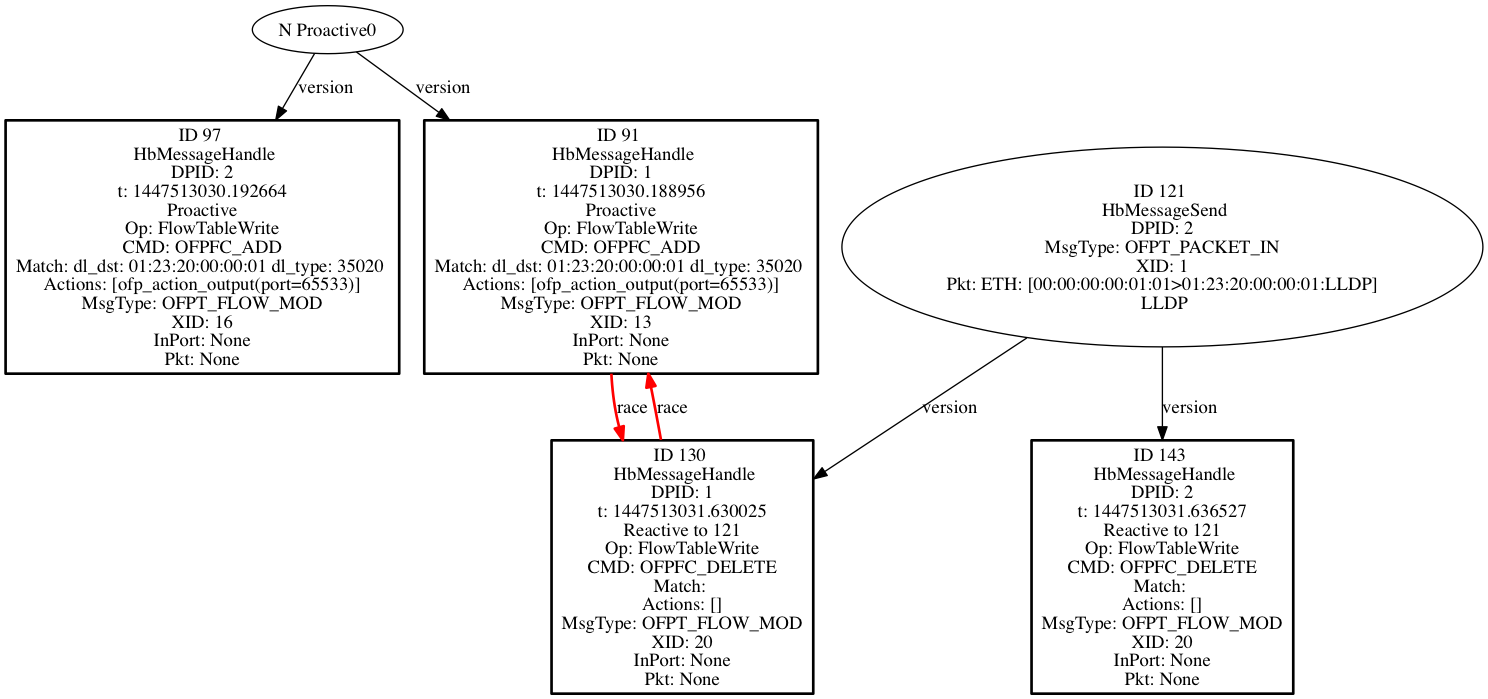
V1:React to event 121, OFPT_PACKET_IN
Eventing racing: [130, 143]
V2:Practive version 0
Eventing racing: [91, 97]
########## Summary ###########
* Race analysis *
Total number of events in the trace: 306
Total number of events with read operations: 50
Total number of events with write operations: 20
Total number of events with read or write operations: 70
Total number of observed races without any filters: 405
Total number of commuting races: 235
Total number of races filtered by Time HB edges: 159
Total number of races covered by data dependency: 4
Remaining number of races after applying all enabled filters: 7 (1.73%)
* Properties analysis *
Number of observed network updates: 28
Number of update isolation violations: 1
Total number of packets in the traces: 20
Number of packet coherence violations: 7
Number of packet coherence violations filtered due covered races: 2
Number of packet coherence but only on the first switch in the update: 0
Number of packet coherence violations after filtering covered races: 5
* Timing information *
Done. Time elapsed: 0.396902084351 s
load_trace: 0.127420186996 s
detect_races: 0.0505919456482 s
extract_traces_time: 0.00830388069153 s
find_reactive_cmds_time: 0.000689029693604 s
find_proactive_cmds_time: 0.0572171211243 s
find_covered_races_time: 0.0188980102539 s
per_packet_inconsistent_time: 0.000638961791992 s
find_inconsistent_update_time: 3.50475311279e-05 s
Overview of SDNRacer output
As we can observe from the output, this trace has 306 events, of which 50 contain read operations and 20 contains write operations. By just using the HB model described in Section 4 in the paper, SDNRacer reports 405 races. By applying commute filter, SDNRacer filters 235 out of the 405 races.
The time-based HB relation, filters 159 races. After applying all the filters, SDNRacer report 7 races the developer. SDNRacer saves the races at just_races.dot.
The entire HB Graph is saved in hb.dot, however, this file is too large to visualize.
For ease of analysis, SDNRacer extracts the important information from the graph and save them in different files:
- Each packet trace, as defined in Section 6.2 in the paper, is extracted and saved in a file called
trace_{SRC_MAC_ADDR}:{DST_MAC_ADDR}.dot - Packets that violated packet coherence property are saved in a file called
race_{SRC_MAC_ADDR}:{DST_MAC_ADDR}.dot - Update isolation violations: SDNRacer prints each pair of versions unisolated, and the specific events in the race.
Analyzing SDNRacer output
In this section, we walk through how a developer will exam the races and the properties violation reported by SDNRacer.
Update isolation property
images/isolation_violation.png
In this trace, SDNRacer reports on update isolation violation. A visualization of this violation is reported at isolation_violation_0.dot. If the developer examines the graph in the file, he/she will quickly observe that the race is between a reactive version, to LLDP packet, and proactive version, to install rules to ask switches to send LLDP packets to the controller. This bug is reported as "Violation#2" in our paper.
Section 3: Generating new random traces
Several configuration files are provided to ease the generation of new random traces. Five files are provided for experimentation:
~/Desktop/sdnracer/sts/config/pldi_pox_angler_l2_multi_forwarding.py
~/Desktop/sdnracer/sts/config/pldi_pox_eel_l2_multi_fixed_forwarding.py
~/Desktop/sdnracer/sts/config/pldi_pox_eel_l2_multi_forwarding.py
~/Desktop/sdnracer/sts/config/pldi_floodlight_loadbalancer.py
~/Desktop/sdnracer/sts/config/pldi_onos.py
Each of these files provides configurations tested within the supplied VM, for several different controllers and applications.
Generating new POX, POX EEL, Floodlight traces
Generating new traces can be done by running simulator.py as follows:
cd ~/Desktop/sdnracer/sts
./simulator.py -L logging.cfg -c config/pldi_pox_angler_l2_multi_forwarding.py
Error messages at the very start related to git (fatal: Not a git repository) can be safely ignored and are not essential to generating new traces:
Similarly, error messages may be printed after the last round of trace generation finishes (default: 200 rounds), this is normal and occurs due to the controller being killed by STS.
The newly generated trace will be written to a subfolder within the ~/Desktop/sdnracer/sts/plditraces directory. Here, the trace will be stored in the following directory:
~/Desktop/sdnracer/sts/plditraces/trace_pox_l2_multi-StarTopology2-steps200
This folder will contain the new trace file (hb.json) as well as a copy of the configuration file that was used to generate this specific trace (orig_config.py). Note that the name of the output folder may depend on the parameters specified in the configuration.
Generating new ONOS traces
For ONOS (pldi_onos.py), the above procedure will not work. Additional steps are needed. In a second terminal, run ONOS:
export ONOS_ROOT=~/Desktop/sdnracer/onos
export KARAF_ROOT=~/Applications/apache-karaf-3.0.5
export MAVEN=~/Applications/apache-maven-3.3.9 && source $ONOS_ROOT/tools/dev/bash_profile
cd "$ONOS_ROOT"
(sleep 30; onos-app localhost install! ../onos-app-samples/ifwd/target/onos-app-ifwd-1.2.0.oar) & export ONOS_APPS=drivers,openflow && ok clean
Wait approx. 30s until you see the following message from ONOS:
onos> {"name":"org.onosproject.ifwd","id":30,"version":"1.2.0","description":"Reactive forwarding application using intent service (experimental)","origin":"ON.Lab","permissions":"[]","featuresRepo":"mvn:org.onosproject/onos-app-ifwd/1.2.0/xml/features","features":"[onos-app-ifwd]","state":"ACTIVE"}
This means that the ifwd application was loaded in ONOS. Now, in the first terminal run STS with the ONOS configuration file:
cd ~/Desktop/sdnracer/sts
./simulator.py -L logging.cfg -c config/pldi_onos.py
Again, an error message may be printed after the last round of trace generation finishes, this is normal. You may close the the second (ONOS) terminal now, and invoke SDNRacer to analyze the trace:
./sts/happensbefore/hb_graph.py plditraces/trace_onos_ifwdnoinstr-MeshTopology2-steps200/hb.json
Modifying configuration files
The provided configuration files may be easily modified, please see the comments within the files themselves on how to do this. E.g. the network topology or the length of the generated trace may be changed by commenting in/out blocks of code. Th number of rounds may be adjusted by varying the steps parameter.
The configuration files and parameters used to generate the results for the paper may be inspected, each trace directory contains the specific configuration (orig_config.py) used, e.g.:
~/Desktop/sdnracer/sdnracer-traces/trace_pox_eel_l2_multi-MeshTopology2-steps200/orig_config.py
Appendix A: How SDNRacer Works
In this section briefly link the important aspects of the paper to our implementation.
How is the HB model is loaded
Each line in hb.json ccontains an event captured while running STS.
SDNRacer will load the trace using def load_trace(self, filename defined in hb_graph.py
and add each event to a graph of HB relations. Each node in the graph is an event (as defined in section 3 in the paper) while each edge is an HB relation between two events.
SDNRacer skips irrelevant messages, such as the handshake messages between the controller and the switches. These messages are defined in SKIP_MSGS in hb_graph.py. Thus in our example, SDNRacer reads 320 events but only add 306 to the HB graph.
Race Detector
After loading the graph of HB relations, SDNRacer invokes the RaceDetector
module (see ./sts/happensbefore/hb_race_detector.py. The method detect_ww_races will search the list of events loaded from the trace and report any two races that don't have HB relations nor they commute as a possible race.
The same for detect_rw_races, but for read/write events.
Commutativity Specification
This functionality is implemented in ./sts/happensbefore/hb_race_detector.py and invoked
by the RaceDetector to check if two events commute or not. See Section 5 in the paper for the commutativity specifications.
Extracting Packet Traces
In order to check packet coherence property, SDNRacer need to extract the packet traces out of the entire network trace. This is defined in Section 6.3 in the paper and implemented in def extract_traces(self, g).
Checking Packet Coherence
Packet Coherence property is implemented in find_per_packet_inconsistent in hb_graph.py.
Appendix B: Custom installation of SDNRacer
This section provides details about how to install SDNRacer in a new VM.
Custom installation if the provided VM image is not used
This section describes how the provided VM was set up.
Prerequisites
-
Ubuntu Image:
- URL: http://releases.ubuntu.com/14.04/ubuntu-14.04.3-desktop-amd64.iso
- MD5 (please verify): cab6dd5ee6d649ed1b24e807c877c0ae
-
VM parameters:
- VirtualBox Version 5.0.14 r105127
- 4GB+ RAM, 32GB+ HDD, 2 CPUs
- Use default settings everywhere unless noted otherwise
- Installation of Ubuntu 14.04.03 LTS 64bit (English, default partitioning settings)
- User: sdnracer, Password: sdnracer
-
Install the VirtualBox Guest additions.
-
Install the following packages on top of the fresh install:
sudo apt-get install git build-essential python-dev ant openjdk-7-jdk python-docutils python-networkx xdot graphviz python-pygraphviz python-matplotlib python-scipy python-numpy gnuplot
Dependencies due to:
- General: git, build-essential
- Hassel: python-dev
- Floodlight: ant, openjdk-7-jdk
- STS: python-docutils
- SDNRacer: python-networkx
- Viewing .dot files: xdot, graphviz
- Plotting: matplotlib, scipy, gnuplot
- Clustering: numpy
Installation of the SDNRacer code
This assumes an install in the home directory, but any other directory works just as well.
SDNRacer, STS, POX, Hassel:
cd ~
git clone https://github.com/jmiserez/sts.git
cd sts
git checkout hb
git submodule update --init --recursive
./tools/install_hassel_python.sh
POX EEL controller:
cd ~
git clone https://github.com/jmiserez/pox.git
cd pox
git checkout eel-hb
Floodlight controller:
cd ~
git clone https://github.com/jmiserez/floodlight.git
cd floodlight
git checkout hb
ant
ONOS prequisites (follows this guide):
cd ~
mkdir Downloads Applications
cd Downloads
wget http://archive.apache.org/dist/karaf/3.0.5/apache-karaf-3.0.5.tar.gz
wget http://archive.apache.org/dist/maven/maven-3/3.3.9/binaries/apache-maven-3.3.9-bin.tar.gz
tar -zxvf apache-karaf-3.0.5.tar.gz -C ../Applications/
tar -zxvf apache-maven-3.3.9-bin.tar.gz -C ../Applications/
sudo apt-get install software-properties-common -y
sudo add-apt-repository ppa:webupd8team/java -y
sudo apt-get update
sudo apt-get install oracle-java8-installer oracle-java8-set-default -y
# accept license terms
sudo update-alternatives --config java
# verify that Java 8 is selected
# logout, login
ONOS:
cd ~
git clone https://github.com/jmiserez/onos.git
cd onos
git checkout hb
cd ~
git clone https://github.com/jmiserez/onos-app-samples.git
cd onos-app-samples
git checkout hb
cd ~
export ONOS_ROOT=~/Desktop/sdnracer/onos
export KARAF_ROOT=~/Applications/apache-karaf-3.0.5
export MAVEN=~/Applications/apache-maven-3.3.9 && source $ONOS_ROOT/tools/dev/bash_profile
# note that the above will rebind certain aliases, you might want to use a separate terminal
cd onos
$MAVEN/bin/mvn clean install -nsu -DskipIT -DskipTests -Dcheckstyle.skip=true
cd ~
cd onos-app-samples
$MAVEN/bin/mvn clean install -nsu -DskipIT -DskipTests -Dcheckstyle.skip=true