cellHarmony - nsalomonis/altanalyze GitHub Wiki
cellHarmony is a cell-matching algorithm designed to identify a cell's most similar analogue in a distinct single-cell RNA-Seq (scRNA-Seq) dataset and find differentially expressed genes in each cell population. A preprint manuscript describing cellHarmony can be found in bioRxiv and a video tutorial on cellHarmony here. Sample data for analysis can be found in the latest version of AltAnalyze (version >=2.1.2) in the DemoData/cellHarmony folder along with instructions.
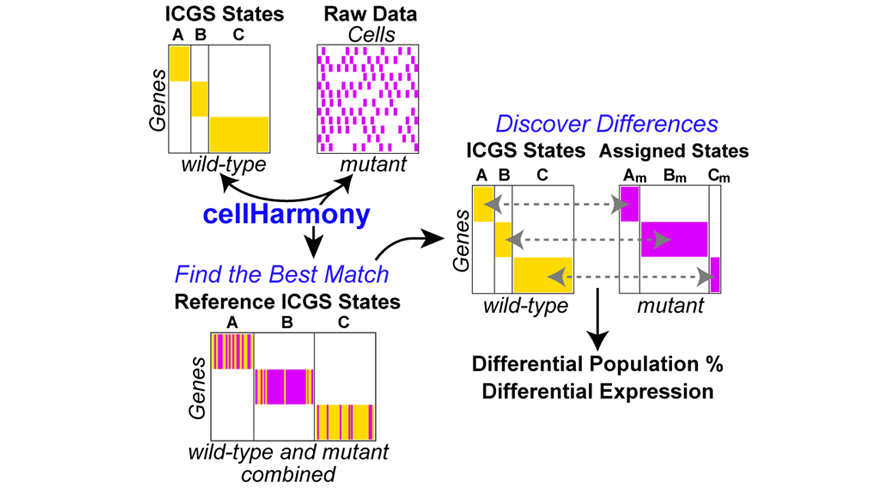
CellHarmony compares the expression profile of a given cell/sample in a query dataset to that in a reference ICGS or MarkerFinder dataset, based on community clustering and alignment approach of a query cell profile to all reference cells. CellHarmony uses ICGS or MarkerFinder derived genes and cells as a reference for deriving lineage predictions for each query single-cell dataset. This approach allows for alignment of cells between distinct datasets and even single-cell technologies. While CellHarmony matches each individual cell in a query dataset to a single cell in the reference, a single reference cell can be associated with many cells in the query. Although designed for scRNA-Seq, the method can be used for any dataset in which ICGS or MarkerFinder was run in AltAnalyze.
cellHarmony Performs the following steps:
- Converts ICGS result text file (Guide3 result or MarkerFinder heatmap text file) from median folds to raw log2 expression files (reference). Inputs from other programs can be used if formatted similar to AltAnalyze inputs.
- Converts input queried gene expression file (unfiltered) to log2 expression (query)
- Converts and links gene IDs in the reference and query to a common ID type automatically.
- Performs a k-nearest neighbor multiclass analysis comparing each cell in the query against each cell in the reference, for matching ICGS reference genes.
- Each classified cell is inserted into the query heatmap and as a separate reference-classified ordered heatmap. Optionally, cellHarmony will align to cluster centroids rather than cells.
- Differentially expressed genes are obtained for common classified ICGS cell-states, comparing query to reference cell expression values for all genes and for each cell state.
CellHarmony produces multiple outputs from its analysis:
- Heatmap of classified cells against the reference in ICGS order (cells and genes) (DataPlots)
- Heatmap of all reference and query cells in ICGS order (DataPlots)
- Similarity scores derived from the LineageProfilerIterate module of AltAnalyze.
- Differentially expressed genes directly comparing query and reference cells for each cell population.
- Ordered differentially expressed gene heatmap with Gene Ontology enrichment analysis (DataPlots)
- Significantly different cell population frequencies.
- UMAP projection of the combined data.
All Results are saved to the query dataset folder (see DataPlots for heatmaps).
First, download the latest version of AltAnalyze from Github, PyPI (pip install AltAnlayze) or http://www.altanalyze.org. Install the appropriate species gene database when prompted. If starting with FASTQ or BAM files, see the main AltAnalyze documentation here.
- Open AltAnalyze and proceed to the main menu. Select your species and platform for analysis.
- Perform ICGS analysis on your query dataset as described here. Find the final ICGS results in the "ICGS", "ICGS-NMF" or DataPlots/MarkerFinder folder within the project output directory. Note, users can also optionally use any AltAnalyze heatmap format text file for analysis or use pre-computed references from here.
- Re-open AltAnalyze and select the same species/dataset options.
- Proceed to the "Additional Analyses" menu, then select the option "Cell Classification" and proceed.
- Under "Select the tab-delimited expression file for cell classification", select an expression file (log2 or non-log raw expression) for the query dataset to be classified. Non-log expression values will be automatically converted to log2.
- Under "Select an ICGS or MarkerFinder reference file", select one of the ICGS text file outputs in the ICGS results or MarkerFinder directory for the reference dataset. We recommend Guide3 results (ICGS) or FinalMarkerHeatmap (ICGS-NMF). Although these results are comprised of relative gene expression differences, the software will find the source expression file (ExpressionInput directory) for the reference ICGS data and output a new reference with the log2 expression values.
- Align to individual cells or cell centroids: The option Align to cluster centroid instead of cells will increase the speed of the analysis and use the cell centroid as a reference rather than aligning to individual cells. This option is recommended when both the reference and input contain thousands of cells. Note: In the demo dataset, align to cells rather than centroids.
- Differential expression analysis parameters: These options control the stringency for the differential expression analyses that are performed on the aligned query cells compared to the reference cells in the same aligned clusters. For the demo, use the adjusted p-value option. You can ignore the LineageProfiler associated options for this analysis.
- Select Continue to run: A black screen will appear. Be patient while the analysis runs. Both tabular and graphical outputs will be produced in the input (query) folder in a new directory named cellHarmony. A log file will also be produced in the folder containing your input (.log). Any errors encountered will be reported in this file.
- To re-visualize these results, perform embedded pathway analysis, the user can go back to the "Additional Analyses" menu, select the "Hierarchical Clustering" option, and select the text file in the query directory with the suffix "-ReOrdered.txt" or "-ReOrdered-Query.txt" for the query only data, with the "Cluster rows" and "Cluster columns" options both set to "no" (use the original clustering). We recommend the user try different color schemes, Heatmap color contrast options, GeneSet cluster enrichment options as more clearly described here.
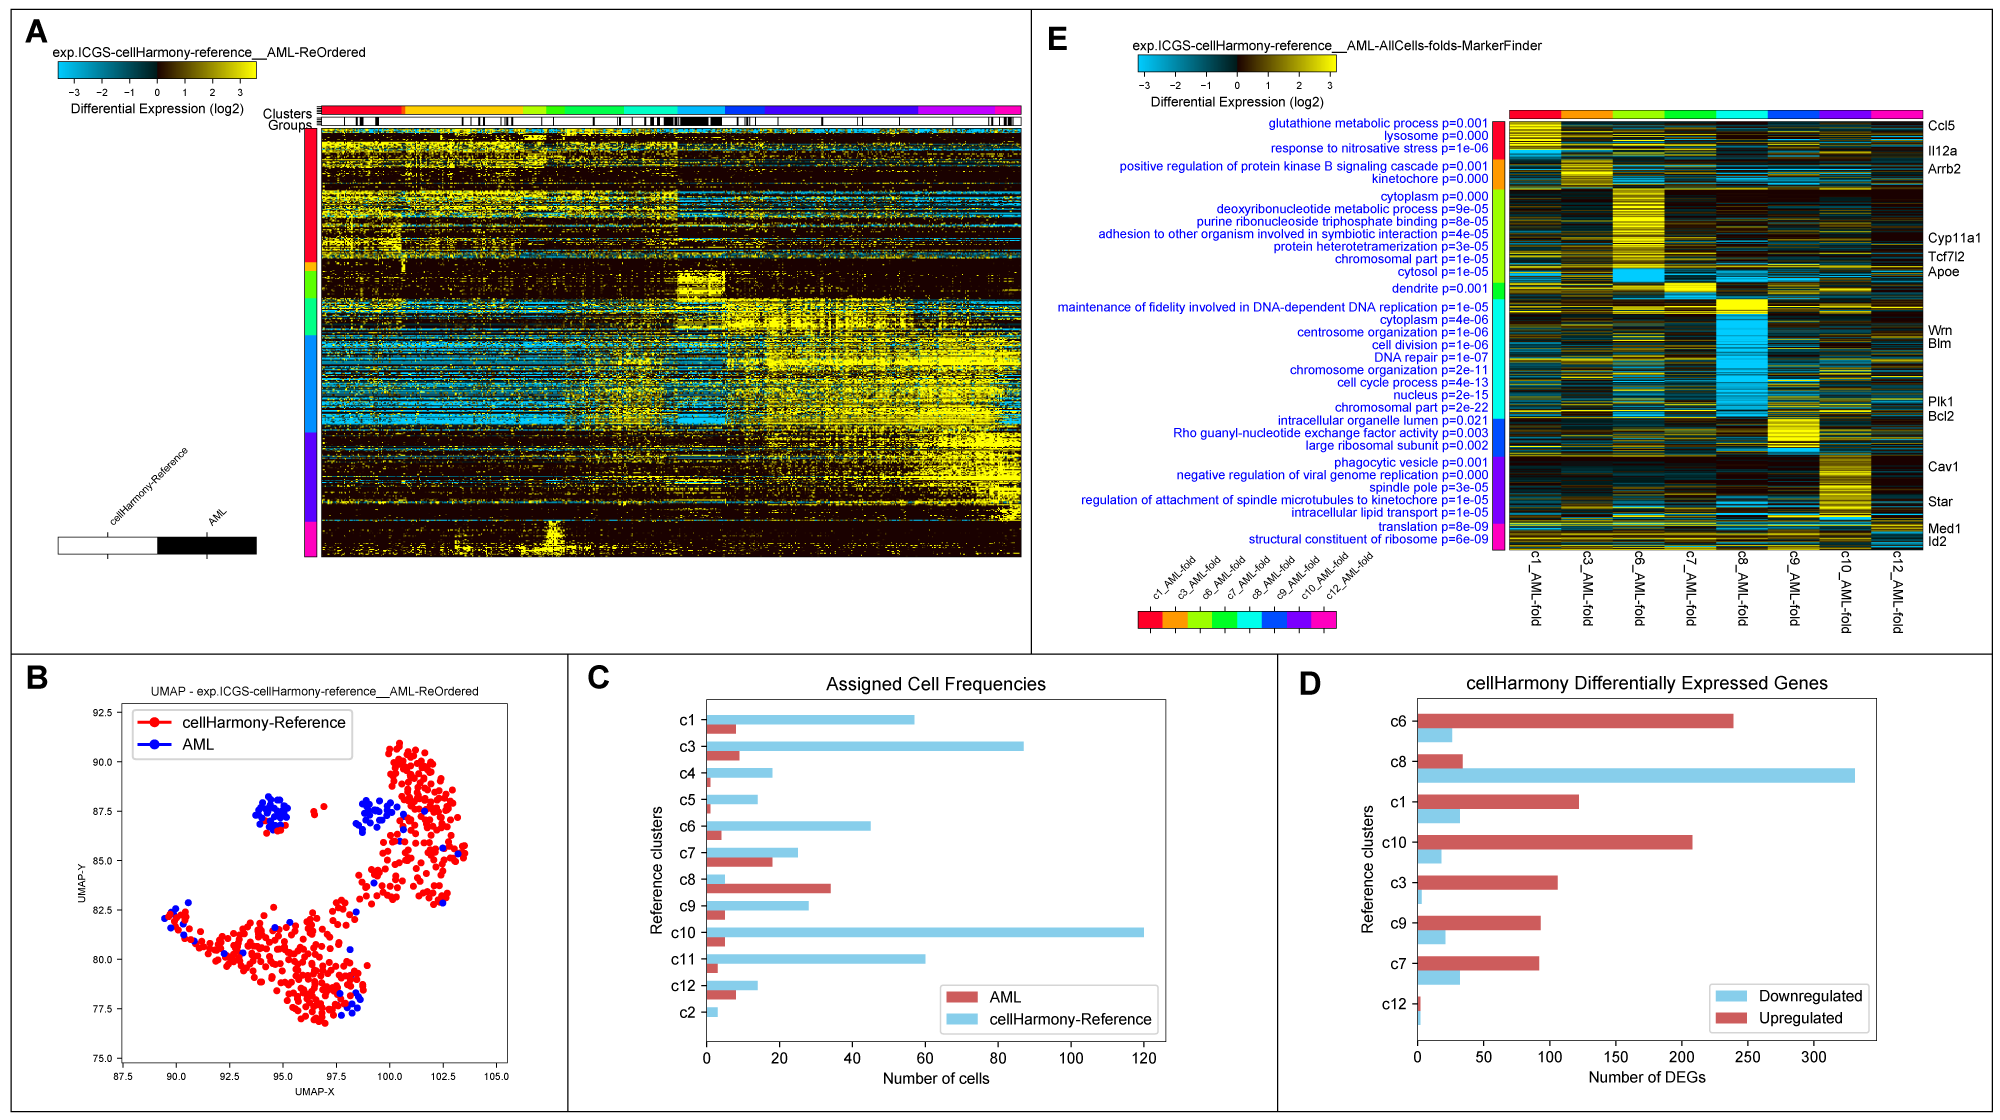
cellHarmony Graphical Outputs. A) Heatmap of matched cell alignments for an murine AML (cytogenetically normal FLT3-ITD and DNMT3A mutant) versus wild-type bone marrow progenitors. B) UMAP projection of AML and wild-type progenitors (reference genes only). C) Number of cells in each reference cell cluster and AML classified cells (cluster 8=dendritic cell precursors). D) Differentially expressed genes per cell cluster (AML vs. wild-type). E) MarkerFinder ordered gene heatmap of differentially expressed genes in all cell populations (AML vs. wild-type) to highlight genes with the greatest specificity for distinct cell populations. Statistically enriched Gene Ontology terms associated with each gene cluster (left) and associated common call-out genes (right) from the integrated software GO-Elite.
Overview See the precomputed-results folder which contains examples. The final results of cellHarmony include:
- Tabular results which detail the alignment scores (Pearson correlation) in the “CellClassification” directory.
- Tabular input text file for the combined query and reference cells in one expression matrix (suffix “-ReOrdered.txt”). Heatmap image file is saved for this file into the folder DataPlots with normalized expression values.
- The same outputs in #2 are saved for the query cells alone (suffix “-ReOrdered-Query.txt")
- UMAP image file with the cells combined from the query and reference for ICGS reference genes (DataPlots folder).
- Summary table and barchart displaying the numbers of genes differentially expressed based on the user-supplied thresholds (gene_summary.txt and gene_summary.pdf files).
- Summary table and barchart displaying the numbers of cells aligned to each cluster (cell-frequency-stats.txt and cell-frequency-stats.pdf files). The text file contains statistics, including the proportion of cells for each assigned cluster and Fisher's exact test p-values comparing the proportion of cells in each cluster.
- Differential Expression Results: Differentially expressed genes are in the folder DifferentialExpression_Fold_1.5_adjp_0.05 or similar.
- A global summary differential analysis results heatmap with embedded pathway analysis results is saved to the DataPlots folder with “folds-MarkerFinder” in its name.
An introduction to running AltAnalyze on the command-line can be found here. The command-line can be run using the PyPi version (call altanalyze), source code (call AltAnalyze.py) or from the GUI code (call ./AltAnalyze.app/Contents/MacOS/AltAnalyze). Prior to running AltAnalyze make sure you install the latest species database (e.g., python AltAnalyze.py --update Official --species Mm --platform RNASeq --version 72). Examples of running ICGS using different single-cell platforms and options can be found in the above introductory link. To produce equivalent ICGS results using the DemoData (normalized expression text file):
altanalyze --runICGS yes --platform RNASeq --species Mm --rho 0.4 --excludeCellCycle conservative --expdir /Users/altanalyze/DemoData/cellHarmony/reference/ExpressionInput/exp.Mm-BoneMarrow_scRNASeq.txt --output /Users/altanalyze/DemoData/cellHarmony/referenceOnce ICGS is run, you can simply run cellHarmony with the below command:
altanalyze --cellHarmony yes --input /Users/altanalyze/DemoData/cellHarmony/input/AML.txt --reference /Users/altanalyze/DemoData/cellHarmony/reference/ICGS/Clustering-exp.Mm-BoneMarrow_scRNASeq.txt --platform "RNASeq" --species Mm --correlationCutoff 0.4 --referenceType centroid --fold 2 --pval 0.05 --adjp True --performDiffExp TrueSee the above graphical user interface description for results file and visualization. To re-generate the heatmaps, the user can run these commands through the command-line as such:
altanalyze --image hierarchical --platform "RNASeq" --species Mm
  --row_method None --column_method None --color_gradient yellow_black_blue
  --GeneSetSelection BioMarkers --display False --contrast 5 --normalization median
  --input "/ExpressionInput/Guide3_exp.isogenic-mutation-ReOrdered.txt"