Tutorial_AltExpressionAnalysis - nsalomonis/altanalyze GitHub Wiki
The below tutorial applies to the analysis of Affymetrix Exon and Gene arrays. A separate tutorial for the analysis of RNA sequencing data and junction arrays can be found here.
The primary use of AltAnalyze is to evaluate alternative splicing, alternative promoters or other forms of alternative gene regulation. To do this, AltAnalyze filters the users raw expression data to remove probe sets considered to be "not-expressed", calculates a splicing score (splicing index or FIRMA fold and t-test p-value), assigns exon/intron/splicing annotations to these results and further evaluates associated protein, protein domain and microRNA binding site composition. AltAnalyze makes this process relatively easy, with the user only required to provide input array files. In the following tutorial we will walk through these steps using a sample dataset and the results that are subsequently produced.
Before you run AltAnalyze, you should have either CEL files or two text files (expression and detection p-values for all probe sets). AltAnalyze can process the CEL files you have in order to produce these two files using built-in calls to the program Affymetrix Power Tools. To download sample CEL files, click here. The group name of each sample is listed here. Otherwise, you can download already processed AltAnalyze expression files from here. These files have data for all 1.4 million probesets on the human Exon 1.0 array.
AltAnalyze can be downloaded for multiple operating systems from http://www.altanalyze.org. Once you have downloaded the compressed archives to your computer, extract these to an accessible folder on hard-drive (e.g., your user account). In addition to AltAnalyze, Cytoscape and DomainGraph are automatically downloaded when a species database is first installed. See the second-to-last step in the Running AltAnalyze instructions for how to immediately start DomainGraph after generating results.
If your dataset has over 30 CEL files or dozens of groups, it may save you time to make the groups and comps files in advance. Although not recommended when working with this sample dataset, go here if this applies to your own dataset.
Now you are ready to process your raw input files and obtain alternative probe sets with splicing and functional annotations. To proceed:
- Open the AltAnalyze_v1release program folder and select the binary file “AltAnalyze”. In Windows, this file has the extension “.exe”. If you are having problems starting AltAnalyze, you can also start the program directly from the source code.
- AltAnalyze: Introduction: In the resulting introduction window, select “Begin Analysis”.
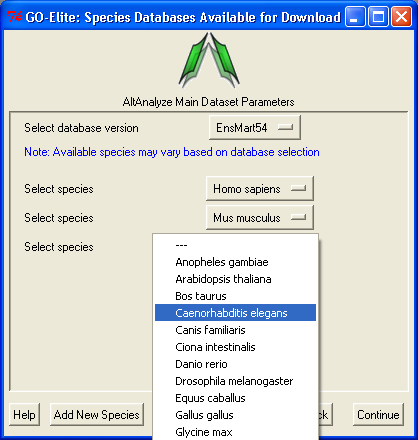
- AltAnalyze: Download Databases: When starting AltAnalyze for the first time you will be prompted to download databases. In this initial prompt, select "Continue", unless you are working on a computer without an internet connection. If the latter applies, click here. Otherwise, select the species "Homo sapiens" from the species select drop down menu (leaving the default Ensembl version) and then "Continue".
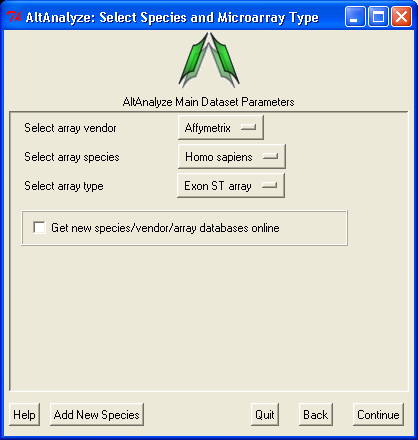
- AltAnalyze: Select Species and Array Type: Select the species type “Homo sapiens”, the array type "Exon ST array" and “Continue”.
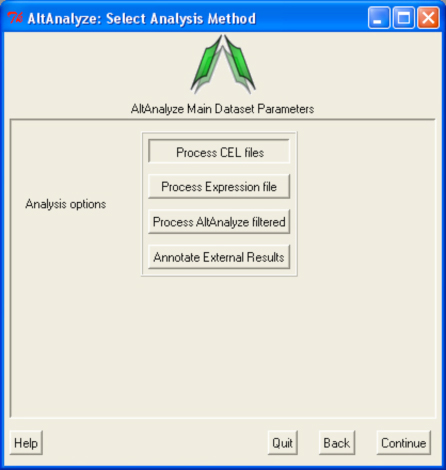
- AltAnalyze: Select Analysis Method: Select the “Process CEL files” button and "Continue".
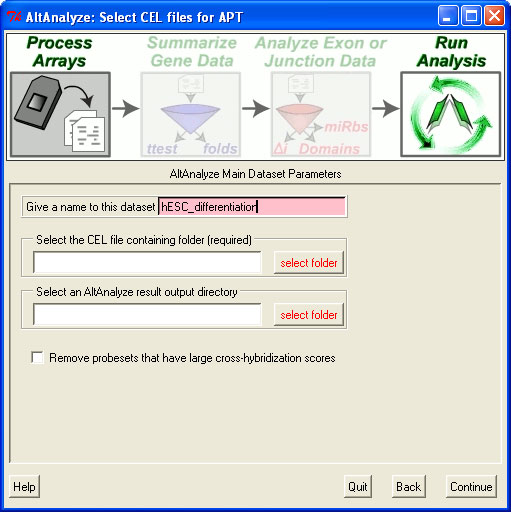
- AltAnalyze: Select CEL files for APT: For dataset name, type in "hESC_differentiation", select the directory containing the CEL files (make sure these have been extracted from the TAR file and Gzip files) and then select an empty directory to save the results to.
- AltAnalyze: Select CEL files for APT: In the resulting warning window, select download for AltAnalyze to automatically download and install the library and annotation files for that array.
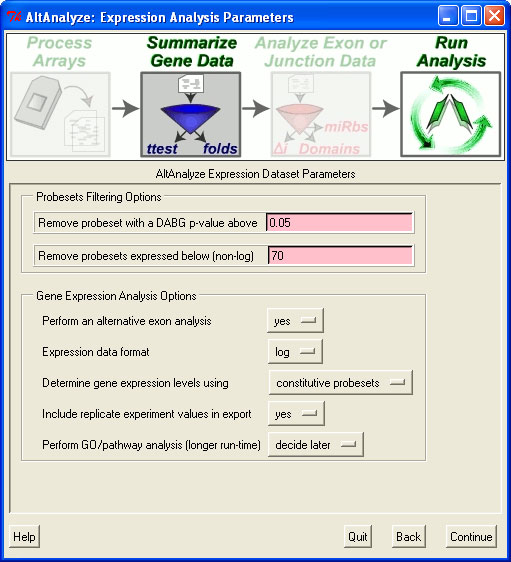
- AltAnalyze: Expression Analysis Parameters: Here, you can either accept the defaults and hit "Continue" or you can select "run immediately" for "Analyze Ontologies and Pathways", the latter of which will let you obtain pathway enrichment and visualization results. These options can be modified later on, if you wish to increase or decrease the stringency of the analysis.
- Performing GO-Elite Analysis within AltAnalyze: If you selected the second option above, you will get this optional menu. To determine if there are biological pathways (WikiPathways) or Gene Ontology (GO) categories that contain a disproportionate number of alternatively regulated genes and even visualize those changes pathways, you can use the GO-Elite option in AltAnalyze. GO-Elite performs typical over-representation analysis (ORA), filter-out redundant GO-terms and pathways for publication ready tables, summarize all AltAnalyze statistics at the pathway level and easily view gene annotations for each pathways. We recommend also selecting the options "Download/Update Additional Resources" and "Visualize all over-represented WikiPathways" here.
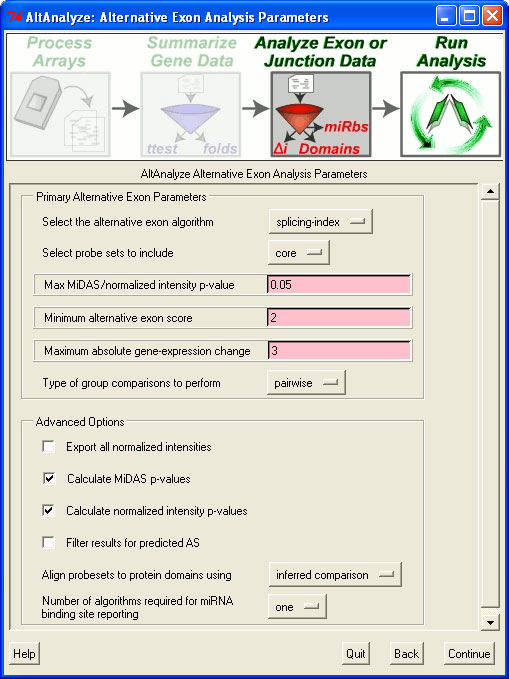
- AltAnalyze: Alternative Exon Analysis Parameters: Accept the default parameters by clicking “Continue”.
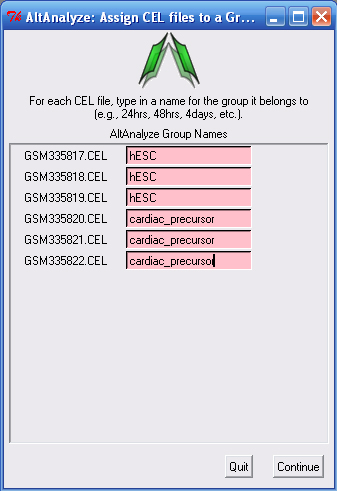
- AltAnalyze: Assign CEL files to a Group: Type in the group name for each sample (first three are hESC and second three are cardiac_precursors).
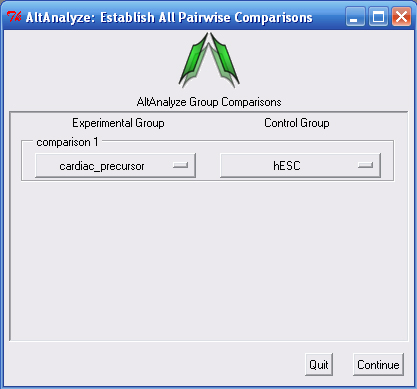
- AltAnalyze: Establish All Pairwise Comparisons: Selects the groups to compare (cardiac_precursors vs. hESC).
- A new window will appear that displays the progress of the analysis. NOTE: On Mac OS X, no progress is displayed for CEL file summarization since this is handled by the program APT. Please be patient during this step. Analysis of the sample dataset should take approximately 20 minutes, but can take longer depending upon the machine and operating system. When finished, AltAnalyze will display a new pop-up window, informing the user that the analysis is complete. If analyzing multiple experimental comparisons, these analyses will be run in succession.
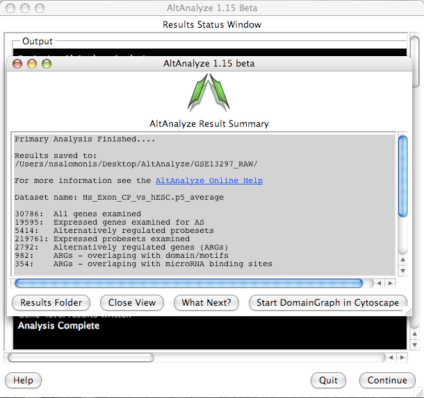
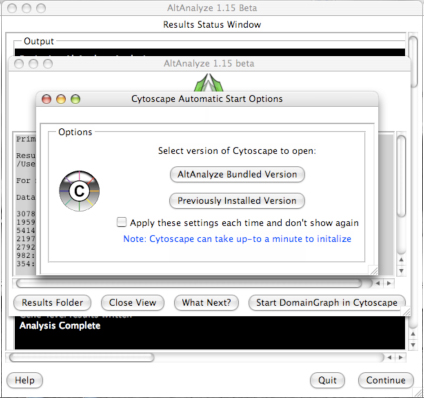
- AltAnalyze: Summary Results: For the last comparison run, overview results are printed to the user interface, including the number of genes with predicted alternative exons, number of genes with predicted domains/motifs and microRNA binding sites affected and number of genes examined. This window will also have the option to Start DomainGraph in Cytoscape. Select this option to immediately open Cytoscape and load your results in DomainGraph (once the DomainGraph database is installed). For more information, click here.
When AltAnalyze was running it produced a number of output files, most to the folder AltResults/AlternativeOutput in the user output directory. These include:
- ExpressionOutput/DATASET-YourExperiment.txt
- AltResults/AlternativeOutput/YourComparison-splicing-index-exon-inclusion-results.txt
- AltResults/AlternativeOutput/YourComparison-splicing-index-exon-inclusion-GENE-results.txt
- AltResults/AlternativeOutput/YourComparison-splicing-index-ft-domain-zscores.txt
- AltResults/AlternativeOutput/YourComparison-splicing-index-miRNA-zscores
These files are tab-delimited text files that can be opened in a spreadsheet program like Microsoft Excel, OpenOffice or Google Documents.
File #1 reports gene expression values for each sample and group in your probeset input expression file. The values are derived from probe sets that align to regions of a gene that are common to all transcripts and thus are informative for transcription (unless all probe sets are selected - see “Select expression analysis parameters”, above) and expressed above specified background levels. Along with the raw gene expression values, statistics for each indicated comparison (mean expression, folds, t-test p-values) will be included along with gene annotations for that array, including putative microRNA binding sites. This file is analogous to the results file you would have with a typical, non-exon microarray experiment and is saved to the folder “ExpressionOutput”.
Results from files #2-5 are produced from all probe sets that may suggest alternative splicing, alternative promoter regulation, or any other variation relative to the constitutive gene expression for that gene (derived from comparisons file). Each set of results correspond to a single pair-wise comparison (e.g., cancer vs. normal) and will be named with the group names you assigned (groups file). If analyzing a multiple groups, the two groups with the largest difference in reciprocal junction scores will be reported along with the conditions these occur in.
File #2 reports probe sets that are alternatively regulated, based on the user defined splicing-index score and p-value. For each probe set several statistics, gene annotations and functional predictions are provided. A detailed description of all of the columns in this file is provided here.
File #3 is a summarization of probeset data at the gene level from file #2. In addition to this summary, Gene Ontology terms and WikiPathways for that gene are reported.
Files #4 and #5 report over-representation results for protein domains (or other protein features) and microRNA-binding sites, predicted to be regulated by AltAnalyze. These files include over-representation statistics and genes associated with the different domains or features predicted to be regulated.
More information about these files can be found in Overview of Analysis Results.
After you run AltAnalyze, the following directory tree and set of files will be generated in the folder that you specified for output. For this example, the species is "species," and we assume there were two comparisons made, between groups A and B, and between groups B and C.
- AltAnalyze_report.log
- AltExpression/
- FullDatasets/
- GeneArray/
- species/
- YourExperiment.txt
- species/
- GeneArray/
- GeneArray/
- species/
- A_vs_B.txt
- B_vs_C.txt
- species/
- pre-filtered/
- dabg/
- A_vs_B.txt
- B_vs_C.txt
- expression/
- A_vs_B.txt
- B_vs_C.txt
- dabg/
- FullDatasets/
- AltResults/
- AlternativeOutput/
- ...
- DomainGraph/
- ...
- RawSpliceData/
- species/
- splicing-index/
- A_vs_B.txt
- B_vs_C.txt
- splicing-index/
- species/
- AlternativeOutput/
- ExpressionInput/
- APT-output/
- apt-probeset-summarize.log
- dabg.report.txt
- rma-sketch.report.txt
- comps.YourExperiment.txt
- exp.YourExperiment-steady-state.txt
- exp.YourExperiment.txt
- groups.YourExperiment.txt
- stats.YourExperiment.txt
- APT-output/
- ExpressionOutput/
- DATASET-YourExperiment.txt
- GenMAPP-YourExperiment.txt
- GO-Elite/
- denominator/
- ...
- GO-Elite_report.log
- GO-Elite_results/
- CompleteResults/
- ORA/
- ...
- ORA_pruned/
- ...
- ORA/
- pruned-gene-associations.txt
- pruned-results_z-score_elite.txt
- CompleteResults/
- input/
- ...
- denominator/
The text file results produced by AltAnalyze can be directly used as input in the protein domain and microRNA binding site visualization program, DomainGraph. DomainGraph is a plugin for the Java program Cytoscape which can be immediately opened from AltAnalyze.
Once over-represented pathways have been found or before doing this analysis, you can see which genes on which pathways are alternatively regulated in the program PathVisio or GenMAPP 2.1. PathVisio is a cross-platform analysis program, while GenMAPP is restricted to Windows. Both tools are easy use and have access to a large archive of curated pathways. An input file for either PathVisio or GenMAPP is found in the directory "ExpressionOutput" with the prefix "GenMAPP-". For making pathways, PathVisio or WikiPathways is recommended, since these resources produce superior pathway content (valid interactions between genes and metabolite IDs) in the same format (gpml). PathVisio can also export pathways to the GenMAPP format. A PathVisio tutorial can be found here, while a GenMAPP tutorial can be found here.