Analysis of John Hopkins University Newsletter Article - npurser/coviddata GitHub Wiki
Background
There was an article published in the John Hopkins University Newsletter by Genevieve Brand about COVID-19 deaths. The PDF of the article can be found here
This link also has references to various other pieces of information including the note from the editor when they took the article offline
The fact checking article didn't really look in depth at the author's data itself to see if it supported the claims. The author has a Youtube video where she goes over much of the same data as the article and includes links to the CDC data she used for her analysis. I have pulled down the same data and will walk through her article to see what is true and what is misleading.
Personal Background
I have no personal background in medicine or epidemiology or anything of the sort. I'm a programmer who has always been interested in data. I have been specifically interested in the All Cause mortality numbers (the Total Number of Deaths) throughout COVID-19 because it seems like the measure least likely to be affected by inaccuracies in how causes of death are attributed and I believe will ultimately be how the severity of the disease will be judged years down the road. I was interested in this article because she stated there hadn't been excess deaths which was contrary to what I'd seen elsewhere. She also included links to the data she was using, which was very helpful in reproducing her research.
Analysis
Deaths by Age Group
The first section of the article has a graph that shows the proportion of deaths for various ages groups. It is based on the data from the 2nd table on this CDC page. They only provided data for this year and I wasn't able to find similar data for previous years to compare against.
The article says
Surprisingly, the deaths of older people stayed the same before and after COVID-19. Since COVID-19 mainly affects the elderly, experts expected an increase in the percentage of deaths in older age groups. However, this increase is not seen from the CDC data. In fact, the percentages of deaths among all age groups remain relatively the same.
"The reason we have a higher number of reported COVID-19 deaths among older individuals than younger individuals is simply because every day in the U.S. older individuals die in higher numbers than younger individuals," Briand said.
Both of these seem accurate from the data to me. The majority of deaths in the US are for those 65 and older and it doesn't appear that the proportion has changed much throughout 2020.
The article goes on to say Briand also noted that 50,000 to 70,000 deaths are seen both before and after COVID-19, indicating that this number of deaths was normal long before COVID-19 emerged. Therefore, according to Briand, not only has COVID-19 had no effect on the percentage of deaths of older people, but it has also not increased the total number of deaths. These data analyses suggest that in contrast to most people's assumptions, the number of deaths by COVID-19 is not alarming. In fact, it has relatively no effect on deaths in the United States.
The conclusions here aren't supported by the data. The numbers of deaths by different age groups doesn't have anything to do with the total number of deaths. She says it has not increased the total number of deaths, but you can't tell that from this data. In fact, her 2nd dataset that we will review later specifically shows that is not accurate at all. Based on the data they are referencing, the statement "In fact, it has relatively no effect on deaths in the United States" is deceiving. It should have been something like "In fact, it has relatively no effect on the proportion of deaths by different age groups in the United States".
One other interesting thing I found is that the CDC actually publishes a dashboard comparing the number of deaths by age group to the same data from 2015-2019. It shows notable increases in death for every age group other than the under 25 age group.
Here is a screenshot of the CDC dashboard

Causes of Death
The next topic is the causes of death, the source data the author used for this is https://data.cdc.gov/NCHS/Weekly-Counts-of-Deaths-by-State-and-Select-Causes/3yf8-kanr https://data.cdc.gov/NCHS/Weekly-Counts-of-Deaths-by-State-and-Select-Causes/muzy-jte6
The article goes on to say
Analysis of deaths per cause in 2018 revealed that the pattern of seasonal increase in the total number of deaths is a result of the rise in deaths by all causes, with the top three being heart disease, respiratory diseases, influenza and pneumonia. "This is true every year. Every year in the U.S. when we observe the seasonal ups and downs, we have an increase of deaths due to all causes," Briand pointed out. When Briand looked at the 2020 data during that seasonal period, COVID-19-related deaths exceeded deaths from heart diseases. This was highly unusual since heart disease has always prevailed as the leading cause of deaths. However, when taking a closer look at the death numbers, she noted something strange. As Briand compared the number of deaths per cause during that period in 2020 to 2018, she noticed that instead of the expected drastic increase across all causes, there was a significant decrease in deaths due to heart disease. Even more surprising, as seen in the graph below, this sudden decline in deaths is observed for all other causes.
She included this chart

This chart is accurate from what I can tell. I was able to reproduce a very similar chart myself. She shows that deaths from various causes decreased in April/May even after COVID was around. I can reproduce this, deaths from various causes did decrease in April and May. On the Youtube video she also shows that the peak of heart disease deaths in April didn't reach the peak from 2018. This is also true, in January 2018 there was an especially bad flu season and the peak of deaths from heart disease in January 2018 was greater than the peak in April 2020. She observed a sudden decline in deaths for nearly all non-COVID causes in April/May. This is true, what she does not mention is that many of those causes had a dramatic increase in March and even through April/May many of them were well above the number of expected deaths from the previous 5 years.
It is much easier to compare different years if you display them overlayed on the chart instead of having one big long line chart that you have to scan back and forth. It also makes comparisons across years more useful as some of these causes of death are seasonal, so comparing heart disease deaths in April from one year to those from January in another year will typically have April much lower as heart disease deaths are higher in the winter months. Here are line charts for each of the top 8 causes of death from the author's dataset for January to early October 2020. The blue lines are the deaths in 2020. The grey lines are the number of weekly deaths from previous years.
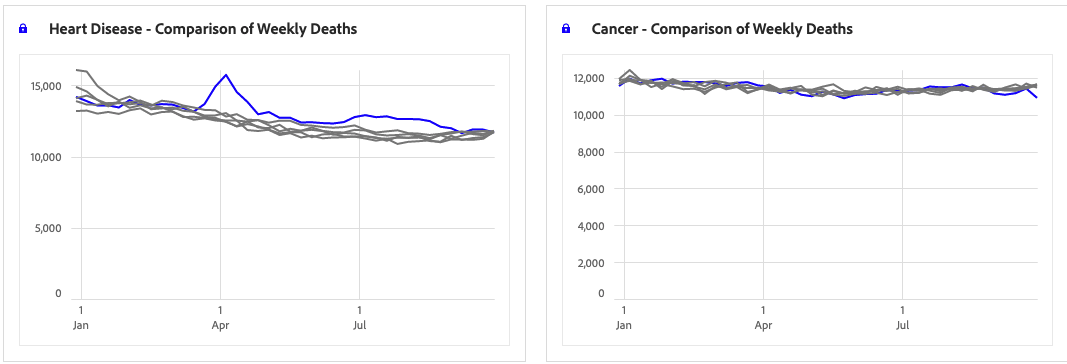


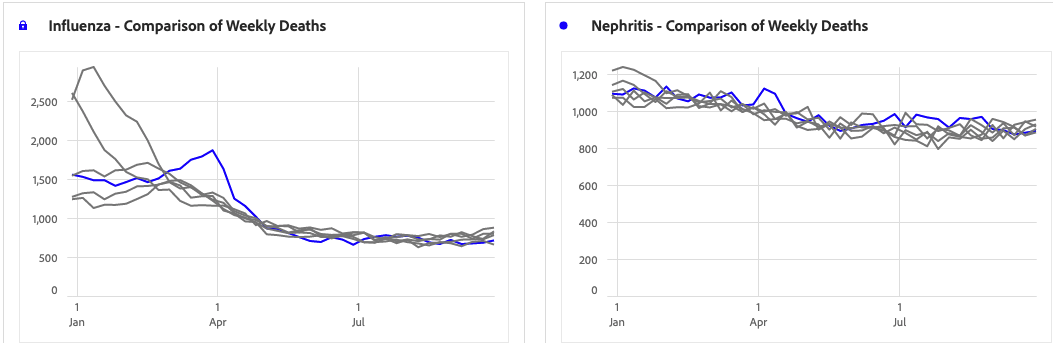
Some things to note
- Deaths for most of these causes have a large spike in March and then a decline through April/May. For many of them the levels in April/May are still well above any of the previous 5 years.
- The exceptions are cancer (appears unaffected by COVID) and Chronic Lower Respiratory (lower than usual, a good chance some of these are being diagnosed as COVID).
The author then says This trend is completely contrary to the pattern observed in all previous years. Interestingly, as depicted in the table below, the total decrease in deaths by other causes almost exactly equals the increase in deaths by COVID-19. This suggests, according to Briand, that the COVID-19 death toll is misleading. Briand believes that deaths due to heart diseases, respiratory diseases, influenza and pneumonia may instead be recategorized as being due to COVID-19.
She includes this table

I spot checked the data in the table, which shows week over week changes in deaths from various causes for 3 weeks in April 2020. I believe she is correct on these. It also matches what I showed in the trend lines above where many causes of death are decreasing from their March/early April peak. She also notes that the decrease week over week lines up closely with an increase week over week of COVID deaths. She also seems to be correct there, COVID deaths continued to increase for a week or two in April after the other causes of death started to fall. She may be correct that other causes of death began to be diagnosed as COVID during mid April. I think it is important to note though that those other causes of death were still well above the levels from previous years, even though they were decreasing from their peaks in March/early April. I think there could be case made that many of these deaths were for people who had pre-existing conditions (alzheimers/diabetes/etc) made worse by COVID and as April went on they started diagnosing the primary cause of death as COVID instead of the pre-existing condition. But we can't tell for sure from this data.
The author then makes the following conclusions
"All of this points to no evidence that COVID-19 created any excess deaths. Total death numbers are not above normal death numbers. We found no evidence to the contrary," Briand concluded. In an interview with The News-Letter, Briand addressed the question of whether COVID-19 deaths can be called misleading since the infection might have exacerbated and even led to deaths by other underlying diseases. "If [the COVID-19 death toll] was not misleading at all, what we should have observed is an increased number of heart attacks and increased COVID-19 numbers. But a decreased number of heart attacks and all the other death causes doesn't give us a choice but to point to some misclassification," Briand replied. In other words, the effect of COVID-19 on deaths in the U.S. is considered problematic only when it increases the total number of deaths or the true death burden by a significant amount in addition to the expected deaths by other causes. Since the crude number of total deaths by all causes before and after COVID-19 has stayed the same, one can hardly say, in Briand's view, that COVID-19 deaths are concerning.
This is where the author really starts to make conclusions that aren't supported by the data. Even a basic review of the exact data files she is using very obviously contradict what she is claiming.
Paper's Claim #1 - Total death numbers are not above normal death numbers. We found no evidence to the contrary.
If you look at All Causes/Total Deaths in the very data files that the author was using, it very clearly shows a large increase in total deaths compared to previous years for each week starting in March. In fact, in her Youtube video she includes the All Cause deaths on her trendline which shows large bumps above historical levels, but she excluded it from the article. Here is a chart created from her data of the All Cause deaths, the blue line is 2020, the grey lines are the lines for the each of the years between 2015 and 2019.

Paper's Claim #2 - What we should have observed is an increased number of heart attacks and increased COVID-19 numbers. But a decreased number of heart attacks and all other death causes doesn't give us a choice but to point to some misclassification.
When you look at her data file it shows exactly what she says we should have observed, an increased number of heart attack deaths above expected historical levels around the times we saw an increase in COVID deaths.

Paper's Claim #3 - Since the crude number of total deaths by all causes before and after COVID-19 has stayed the same, one can hardly say, in Briand's view, that COVID-19 deaths are concerning.
Again, the data does not say this. The crude number of total deaths by all causes before and after COVID-19 spiked significantly in March and have remained well above levels from previous years since then. Up through the week ending October 17th, more than 300 thousand people have died this year than by that same point last year. Even excluding the ~200 thousand deaths attributed to COVID that is still more than 100 thousand people than had died by that point last year. That is a significantly larger difference than any of the previous years.

Conclusion
The author has cherry-picked a handful of narrow data points that are true and uses them to suggest that the number of deaths have not materially changed this year and to imply that increases from COVID have been offset by decreases in other causes of death. This is simply not true, and even a basic look at the author's data shows that both overall deaths and deaths from medical causes other than COVID have been significantly higher than the previous 5 years.
Additional Information
As part of my research I found that the CDC publishes a number of dashboards that show comparisons of deaths this year vs expected levels based on previous years. This includes breaking it down by state, age, cause of death and various other factors. It is easy to play around and by drilling into specific states I was able to easily see how the numbers of excess deaths correlated with known COVID outbreaks (for example, New York in the spring, Florida and Texas in the summer).
You can view their dashboards here https://www.cdc.gov/nchs/nvss/vsrr/covid19/excess_deaths.htm