NOX GUI - noxrepo/nox-classic GitHub Wiki
The GUI is a frontend to NOX that provides network visualization and monitoring, and also serves as an interface for the user to communicate with NOX in runtime. It can be extended with custom views order to visualize custom characteristics for research or demo purposes, or with custom input in order to trigger NOX component functions.
The gui is implemented in python and uses the QT library. It communicates with NOX by way of JSON messages exchanged with the messenger component (simplejson should be already installed if you are running NOX). For Ubuntu:
apt-get install python-qt4 python-simplejson python-qt4-sql

To start the GUI run
./nox-gui.py
in the /src directory. If NOX is not running, it will retry to connect until NOX replies. NOX should be initiated with (at least) the 'monitoring' component. Although the GUI is distributed with NOX, it is a standalone program and does not necessarily need to run on the same host. To run the GUI remotely, run
./nox-gui.py <NOX IP>
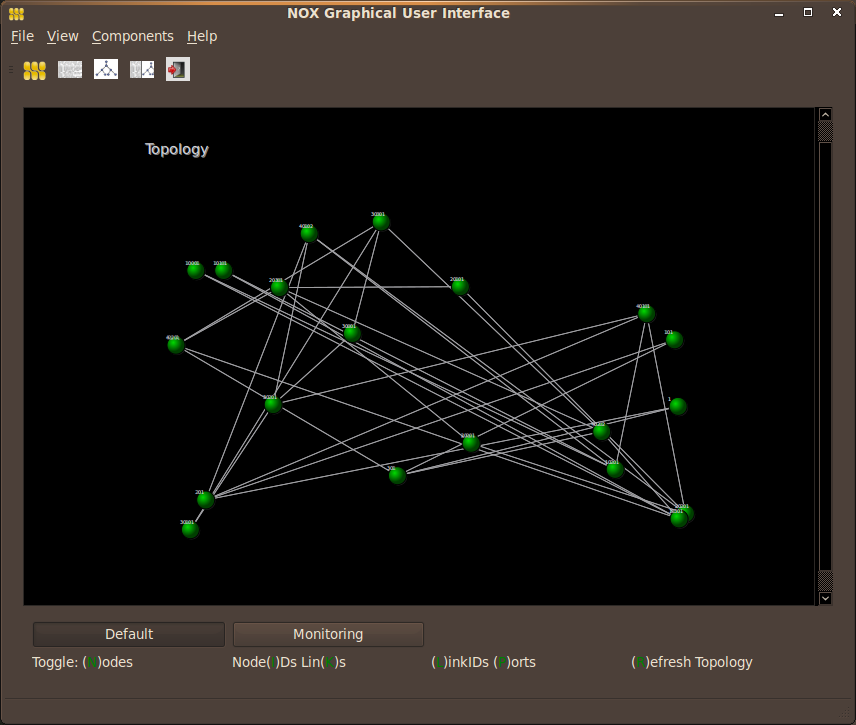
When the GUI connects to NOX the screen shown above will popup. You will see debugging messages on the left side. If there is a network connected to NOX, it will be discovered by 'Discovery' and advertised to NOX by 'LAVI' through 'jsonmessenger', and so the topology will start getting populated.
The interface consists of 2 basic elements, the Log view and the Topology view, as well as the Console widget. The user can switch between Log / Topology / Split view by clicking on the corresponding toolbar icons, or using the shortcuts Ctrl+1 - Ctrl+4

The Log view normally displays all log messages generated by NOX. This is what the usual NOX console output. The difference is that through the GUI, the user can apply wireshark-like filters to the output and focus on one or several components or verbosity levels, which makes debugging easier. (Switch to this view by hitting Ctrl+1)

Clicking on the Components button will popup a list of components that are currently active. A component must have generated at least one debug message in order to appear on this list. Checking one or more components and clicking ok, will apply the relevant filter and display only messages generated by these components. Alternatively the user can directly type the filter on the corresponding textbar, giving a coma or space separated list of components and clicking on "Filter". By default, all components are displayed.
Clicking on the Verbosity button will popup a list of verbosity levels. By default all levels are displayed, but a user might change this in order to display, for example, only ERROR messages (which can specifically filter out syntax errors in the code), or DEBUG messages (which can help with logic errors), etc.
This allows to focus on a specific timeframe, freezing the log output.
The GUI learns the topology from LAVI, by way of JSON messages communicated through the ‘messenger’ component. The topology view is interactive, meaning that the user can select what items will be displayed (relevant hotkeys are described in the Default view), move them around and also interact with the physical devices they represent. (Switch to this view by hitting Ctrl+2)
The topology is refreshed automatically when LAVI notices a topology change.Pressing ‘R’ on the topology view will also actively poll the backend for a current topology snapshot, although this should never be required. LAVI reports 2 separate links for each bidirectional link. So there are 2 drawn link objects (overlapping) per link. This can be noticed as the drawn topology is refreshed and some links turn thicker; this is when discovery reports the opposite direction link.

The nodes are initially positioned randomly. Pushing the ‘Space’ button repositions nodes randomly. The user can move the nodes around and store a layout for a given topology. The positioning is stored in files under ‘/layouts’, and is simply a mapping of nodeIDs to coordinates. A custom topology layout can be loaded the next time the GUI runs. To bring up the save/load layout menu, right click anywhere on the topology view background.

Right-clicking on a node brings up a context menu through which the user can see information about the node and query it for statistic. The available requests are under 'Get Switch Stats' and include Port, Table, Aggregate, Flow and Queue statistics, as well as the latest snapshot of the node's state. The retrieved information is displayed on the Log view. Double-clicking on a switch displays its current flow table.
The ‘Default View’ displays a simple representation of the nodes and links in the topology, with default coloring. Users can extend the GUI with their own views that focus on the functionality of their NOX component. The 'Monitoring' view which is developed as such an extension, provides an example of this. Although the switch querying functionality is exposed to the default view, it is actually implemented in the monitoring view. This is where the querying messages are constructed and sent to NOX’s messenger, which in turn dispatches them to whichever NOX component is responsible for handling them (in this case, the ‘Monitoring’ component). This view also paints link based on their current utilization.
The utilization information is retrieved from the Monitoring backend. Looking at these examples provides an idea of developing custom views tied to a NOX component. The process of extending the GUI with custom views is described in the next section.
This widget provides an interface for the user to send manual JSON commands to a NOX component through the messenger component. For example, such a command is sent to NOX when the GUI requests the current topology from LAVI, or when a user queries the monitoring component for information about a switch. Ideally the sending of such commands it triggered transparently by interacting with the topology view as described above, but this console allows manual sending of custom commands, for debugging purposes. (Toggle this view by hitting Ctrl+4)
Extending the GUI requires some basic python and Qt knowledge, but especially for simple cases can be done by following the example of the existing provided views
This section describes how a custom view is created on the GUI. Custom views are used to highlight different things that a user might be interested in, and also to show information related to a custom NOX component. All custom views extend the superclass 'View', that provides an abstraction to topology views in the GUI.
We will walk through the Spanning Tree view as an example, and initially focus on GUI-related programming, forgetting about any communication with NOX.
In their constructors, custom views must define a view name:
self.name = "STP"
Buttons specific to the custom view may be added. These will appear on the secondary bar under the topology view, when the custom view is active. The buttons can trigger anything the developer/user wants. In this case we just add a button that pops up an information message about the view.
        # Add custom view buttons
        infoBtn = QtGui.QPushButton('What is STP?')
        self.connect(infoBtn, QtCore.SIGNAL('clicked()'), self.showInfo)
        self.buttons.append(infoBtn)
Any other state related to the component and the view may be initialized here. Custom views have access to the way nodes and links are drawn. This is done by overwriting the methods node_color(), link_color() and link_pattern(). Spanning tree paints STP enabled links green, disabled links dotted gray, the ST root yellow and the leaves the rest of the nodes to the default color.
After writing your custom view you need to make some changes for it to be included in the topology widget:
In topology.py
on the top, add
from views.sample_routing import STP_View
and in the constructor of the TopoWidget class, add
        self.stp_view = STP_View(self)
        self.views[self.stp_view.name] = self.stp_view
This section describes how the communication between NOX components and their GUI views works. As an example we will walk through the case of 'spanning_tree'.
'backend' refers to the NOX backend component, and frontend refers to the GUI's corresponding view.
In the backend:
on the top add
from nox.coreapps.messenger.pyjsonmsgevent import JSONMsg_event
and in install():
        # Subscribers for json messages
        #(eg. self.subscribers["stp_ports"] = [guistream]
        self.subscribers = {}
The above will make the component listen for incoming messages from the GUI, and initialize a list of streams (in our case the GUI) which will get populated as subscribers show interest for messages generated by this component.
Also, implement the methods handle_jsonmsg_event() and send_to_gui(), which handle a json message received from the GUI (typically a 'subscribe' message) and construct a message to be sent to the GUI respectively
In the frontend:
in the constructor, subscribe for any messages from the backend that we are interested in:
        # Subscribe for stp_ports
        msg = {}
        msg ["type"] = "spanning_tree"
        msg ["command"] = "subscribe"
        msg ["msg_type"] = "stp_ports"
        self.topologyInterface.send( msg )
and connect reception of messages for the backend to a handler:
       # Connect signal raised when msg arrives from backend to handler
        self.topologyInterface.spanning_tree_received_signal.connect( \
            self.got_json_msg )
Implement a handler (got_json_msg()), that handles incoming messages and possibly updates local state accordingly, or directly draws something on the topology/log view etc. In the spanning_tree case, we simply update our view of the spanning tree so that we can color nodes/links accordingly. (Views have access to the log view, for example, the monitoring view draws switch information on it after the user polls a node for statistics)
Finally, in communicaton.py, define a new signal, eg:
    # Signal used to notify STP view of new msg
    spanning_tree_received_signal = QtCore.pyqtSignal(str)
and in the Listener, add a case to handle your message 'type' and emit the signal you defined above, eg:
    # Signal used to notify STP view of new msg
    spanning_tree_received_signal = QtCore.pyqtSignal(str)
If 'monitoring' is not first on the argument list, add 'jsonmessenger' to your component's meta.json. (Since the GUI requires 'monitoring' if and 'jsonmessenger' is a dependency for it, if 'monitoring' comes first on the argument list for ./nox_core, then this is redundant.)
Watch a short video of the GUI here