Old: Color table tutorial - northern-bites/nbites GitHub Wiki
Our robots get visual information as frames. Each frame consists of data in the YUV format. Actually it is in a YUV variant (YCbCr). See wikipedia for more on the differences. For our purposes it is a bunch of tuples of numbers. Each number is between 0 and 255. What we would like to do (for now) is to turn these numbers into useful colors like GREEN or ORANGE. There are lots of ways to do this in computer science (e.g. machine learning), but since we want something that is super fast we essentially create a giant look-up table called a color table. In principle such a table would contain 256256256 values. For any tuple of values (e.g. (127, 210, 58) you would just look in the appropriate place in the table and it would tell you what color is assigned to those values (if any). In practice smaller tables work a bit better as they are more compact and generalize better. They are also easier to create as you don't need to fill in lots of values. We get smaller tables by throwing away low order bits (e.g. divide by 2, then multiply by 2).
The process of creating a color table is sometimes referred to as painting in RoboCup because what you essentially do is take an unclassified image and "paint" in the values by filling in the color table. This used to be a very tedious process involving clicking on individual pixels and it would take at least 6-8 hours to make a decent table. Fortunately we have improved and it is only moderately tedious now. Ultimately our goal is to get rid of color tables altogether, but color is so useful to vision that it is hard to get it completely out.
In principle the goal in making a color table is pretty simple: yellow things should be classified as YELLOW, green things as GREEN, etc. In practice it is often much more difficult than that, mainly due to the limitations of the camera, lighting, etc. The actual goal is a little more subtle. What we want out of our color table is that it will enable the vision system to correctly recognize the objects on the field (goals, robots, etc.), but also that it will not falsely see objects that are not actually there. So in the process of making a color table one thing that you normally want to do is check out what the vision system actually sees (as opposed to how it looks to your own eyes).
For another view on color tables look at the UPennalizer page
The first thing you need to make a color table is data. We keep such data as logs. You can navigate to data/logs and find the sync script there to grab existing logs from our server. You can use them to practice. But it would be better to get the data yourself. This is described in our wiki in How to Take a Log. During the act of making a color table you will learn a lot about good logs and bad. But suffice it to say that good logs contain lots of images of the various field stuff (goals, lines, balls, robots) at lots of different angles and from lots of different distances.
Color tables are now made in the QTool. To run the QTool you should first navigate to src/qtool. Once there you'll need to:
$> make run
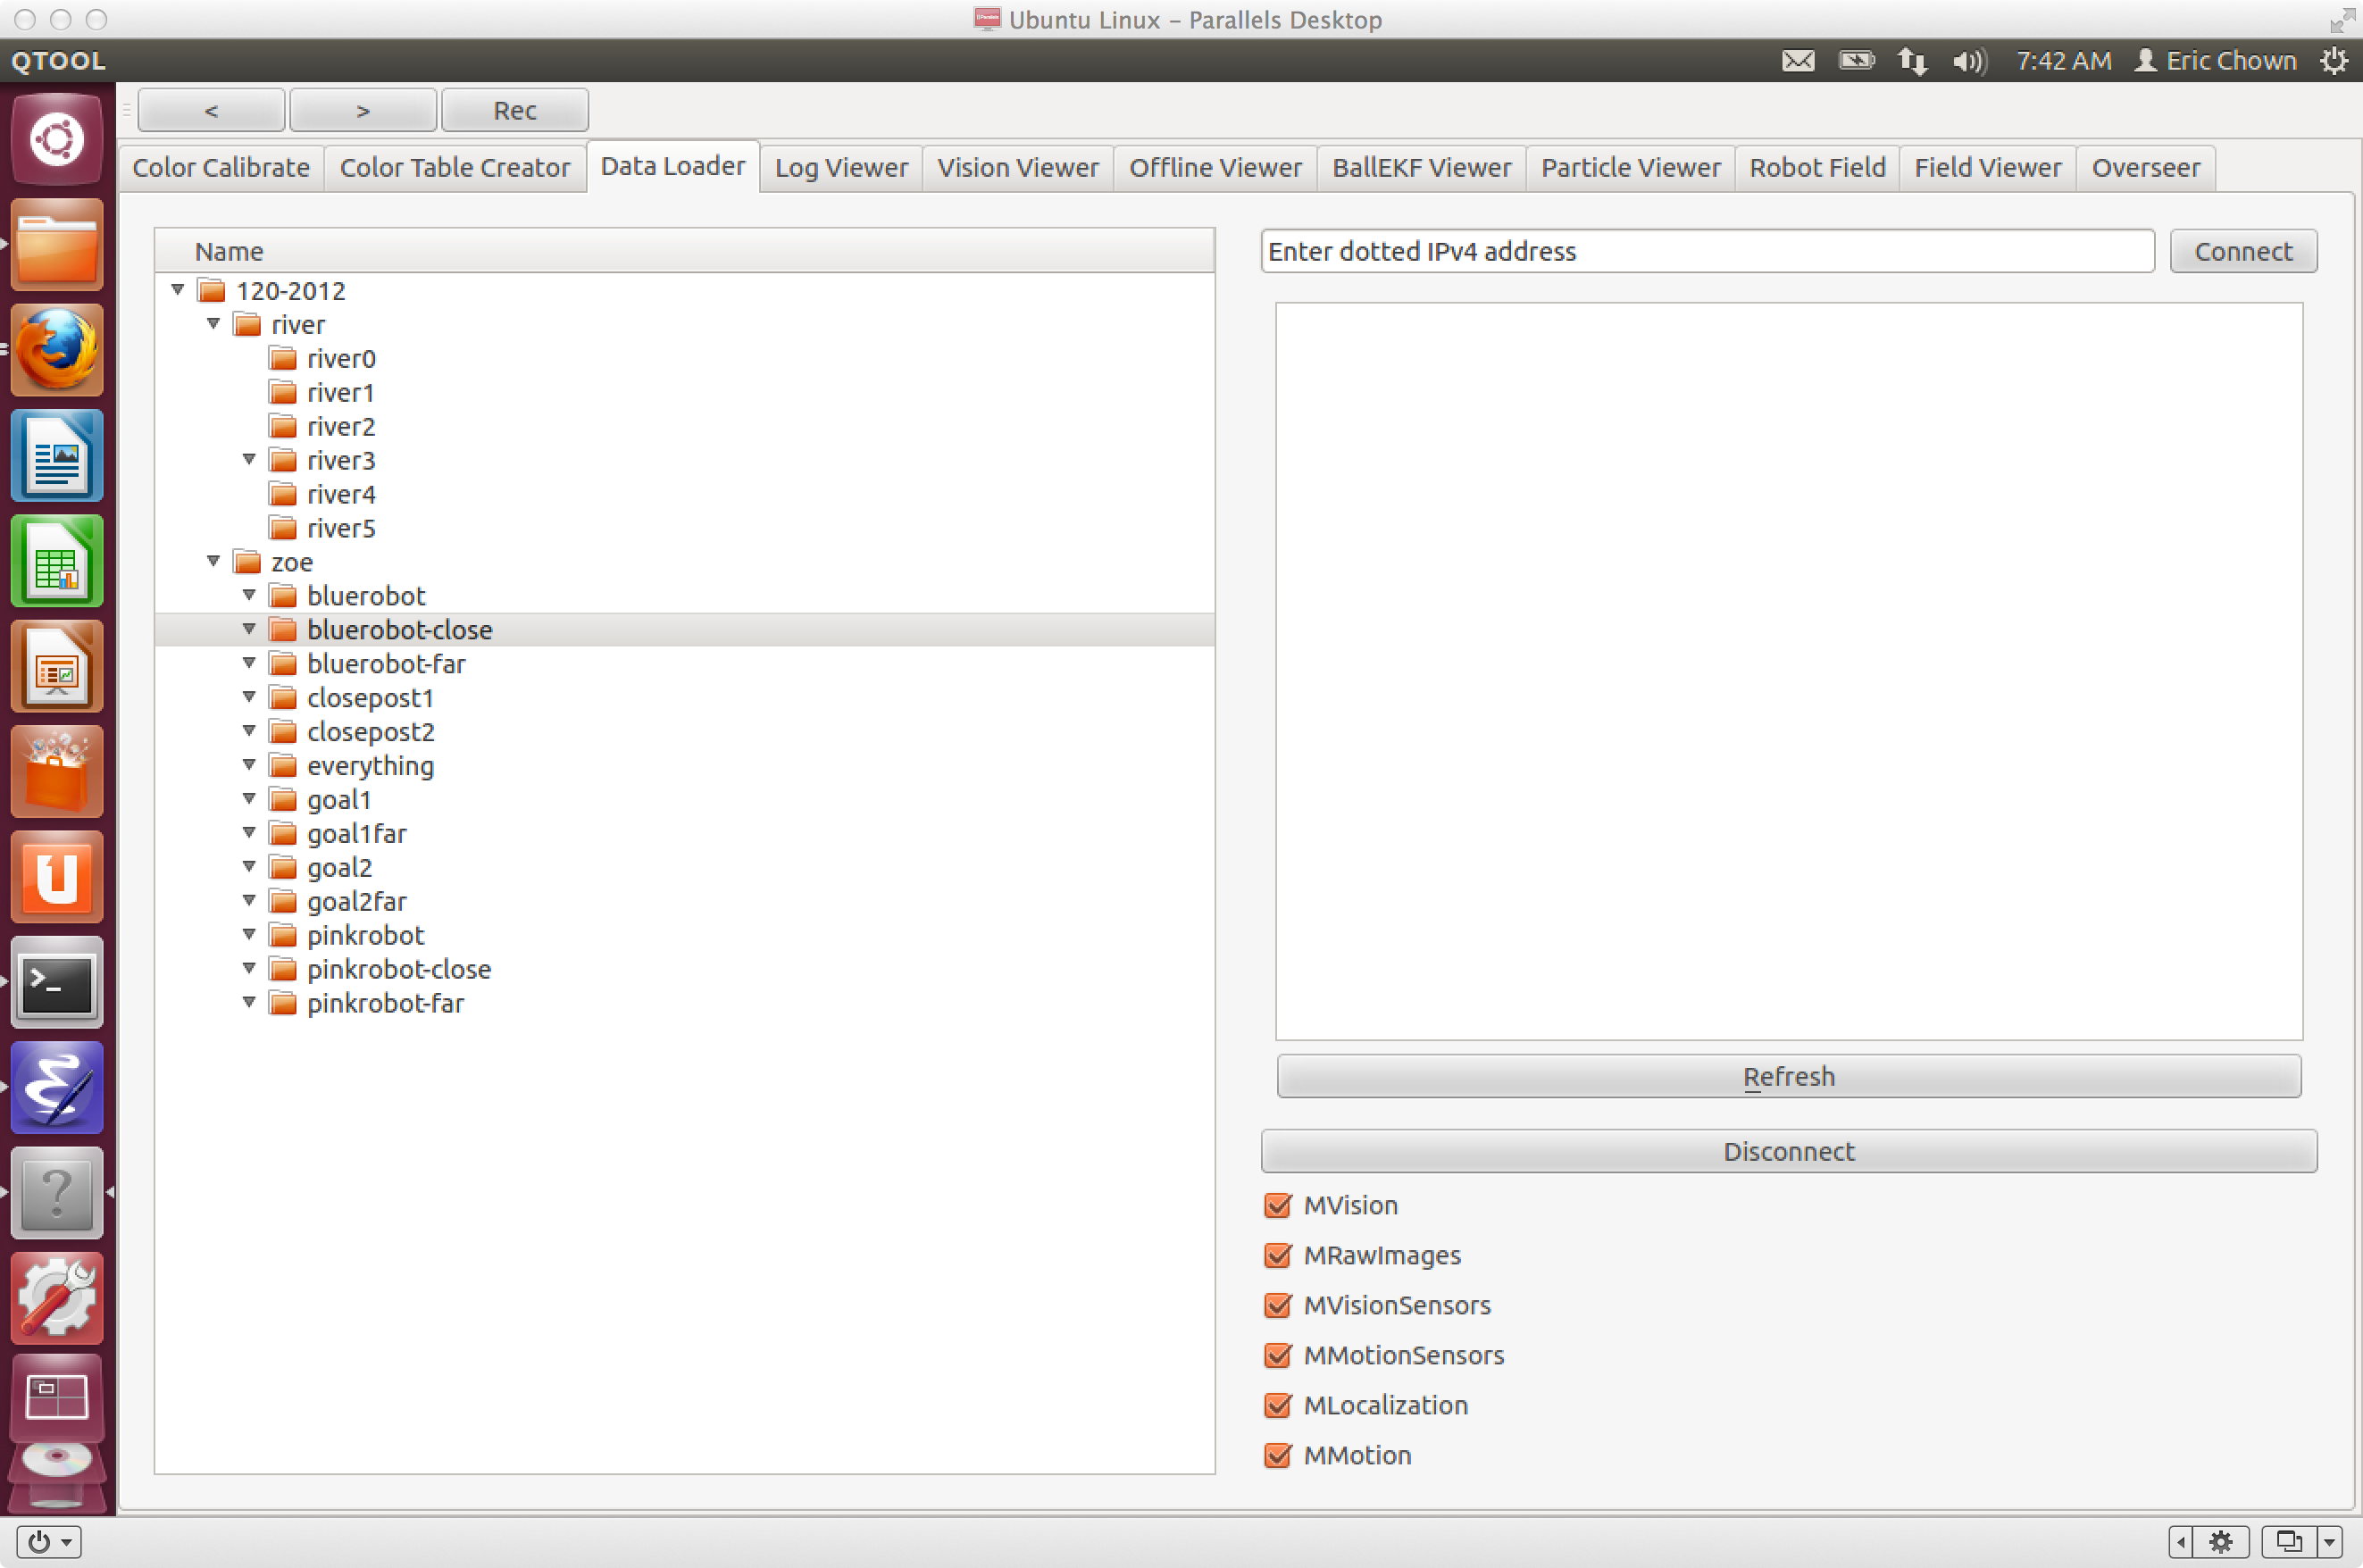
This will bring up the tool. Next you'll need to load some data. If you pick the Data Loader tab of the QTool it will go to your logs directory and display whatever logs you have collected/downloaded. Double-click one to load it.
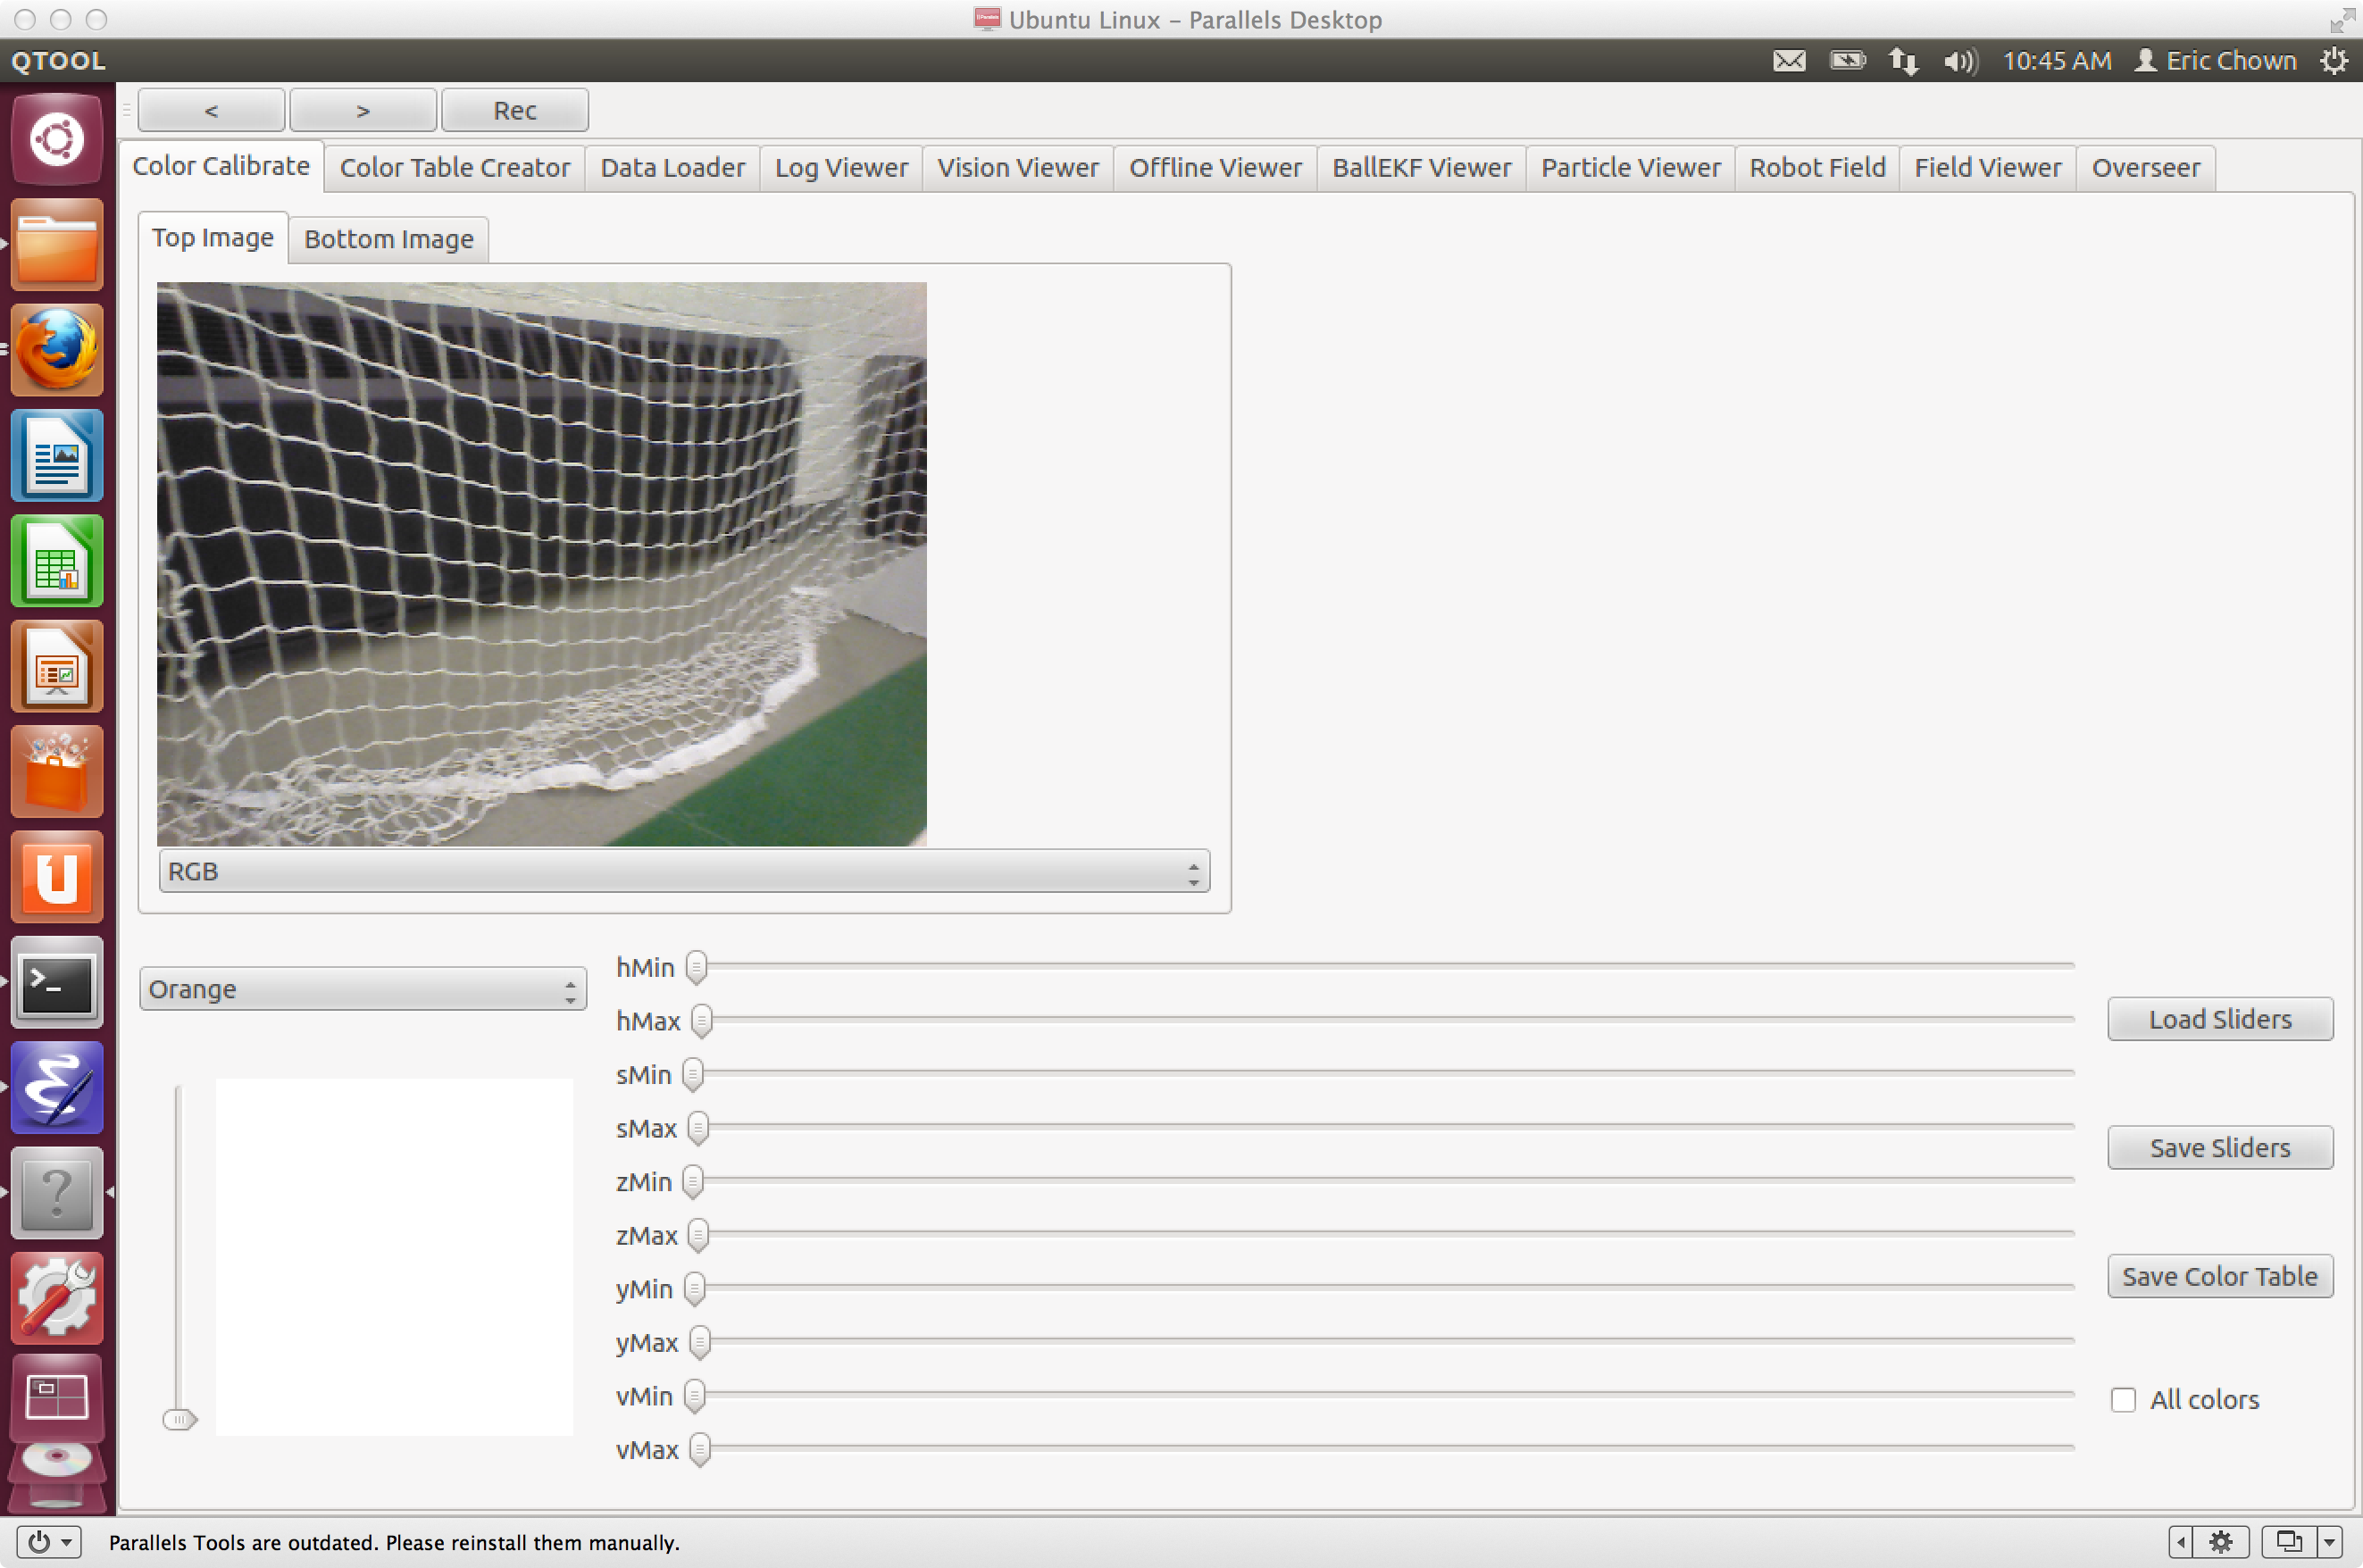
Now switch over to the Color Calibrate tab of the tool.
Now that we have two cameras on the left you will see a tab for selecting between the top and the bottom image. For now, neither of these will display anything until you select a new frame (a good issue for anyone reading this to resolve). On the bottom you'll see a series of sliders and a few buttons. At the left of all of this you can select any of our colors to work on. The default is Orange. On the bottom right there is a check box controlling whether you just see things that are painted orange, or whether you see all of the current colors. Meanwhile, you can choose to view the image on the left in its raw form (the kind of image you expect to see) which is labeled RGB or you can view individual channels by selecting them from the menu under the image. For example, you can view the Y channel of the image to get a sense of which colors have high or low Y values.
It helps to visualize colors as a three-dimensional space. If you are having trouble it is always best to start with XKCD. We are going to use the sliders to carve up the color space into chunks. Ideally the sliders for ORANGE, for example, will carve out the orange part of the color space without getting too much into other colors.
The sliders represent what part of the color cube we are defining as that particular color. Our goal is to find the minimum space in the cube that actually correctly colors our field objects. A good place to start is to load up some starter values for the sliders. If you have gone to the data/sliders directory of your code, you can run ./sync down to get our saved sliders. One of these is named starter.sld this is what you want. You'll notice that the values it loads look odd - e.g. the min values are set to high numbers while the max values are set to low numbers. The reasons for this will become clear as you read on. One exception to this are the H sliders - they get default values based on past experience (and inspired by the XKCD post).
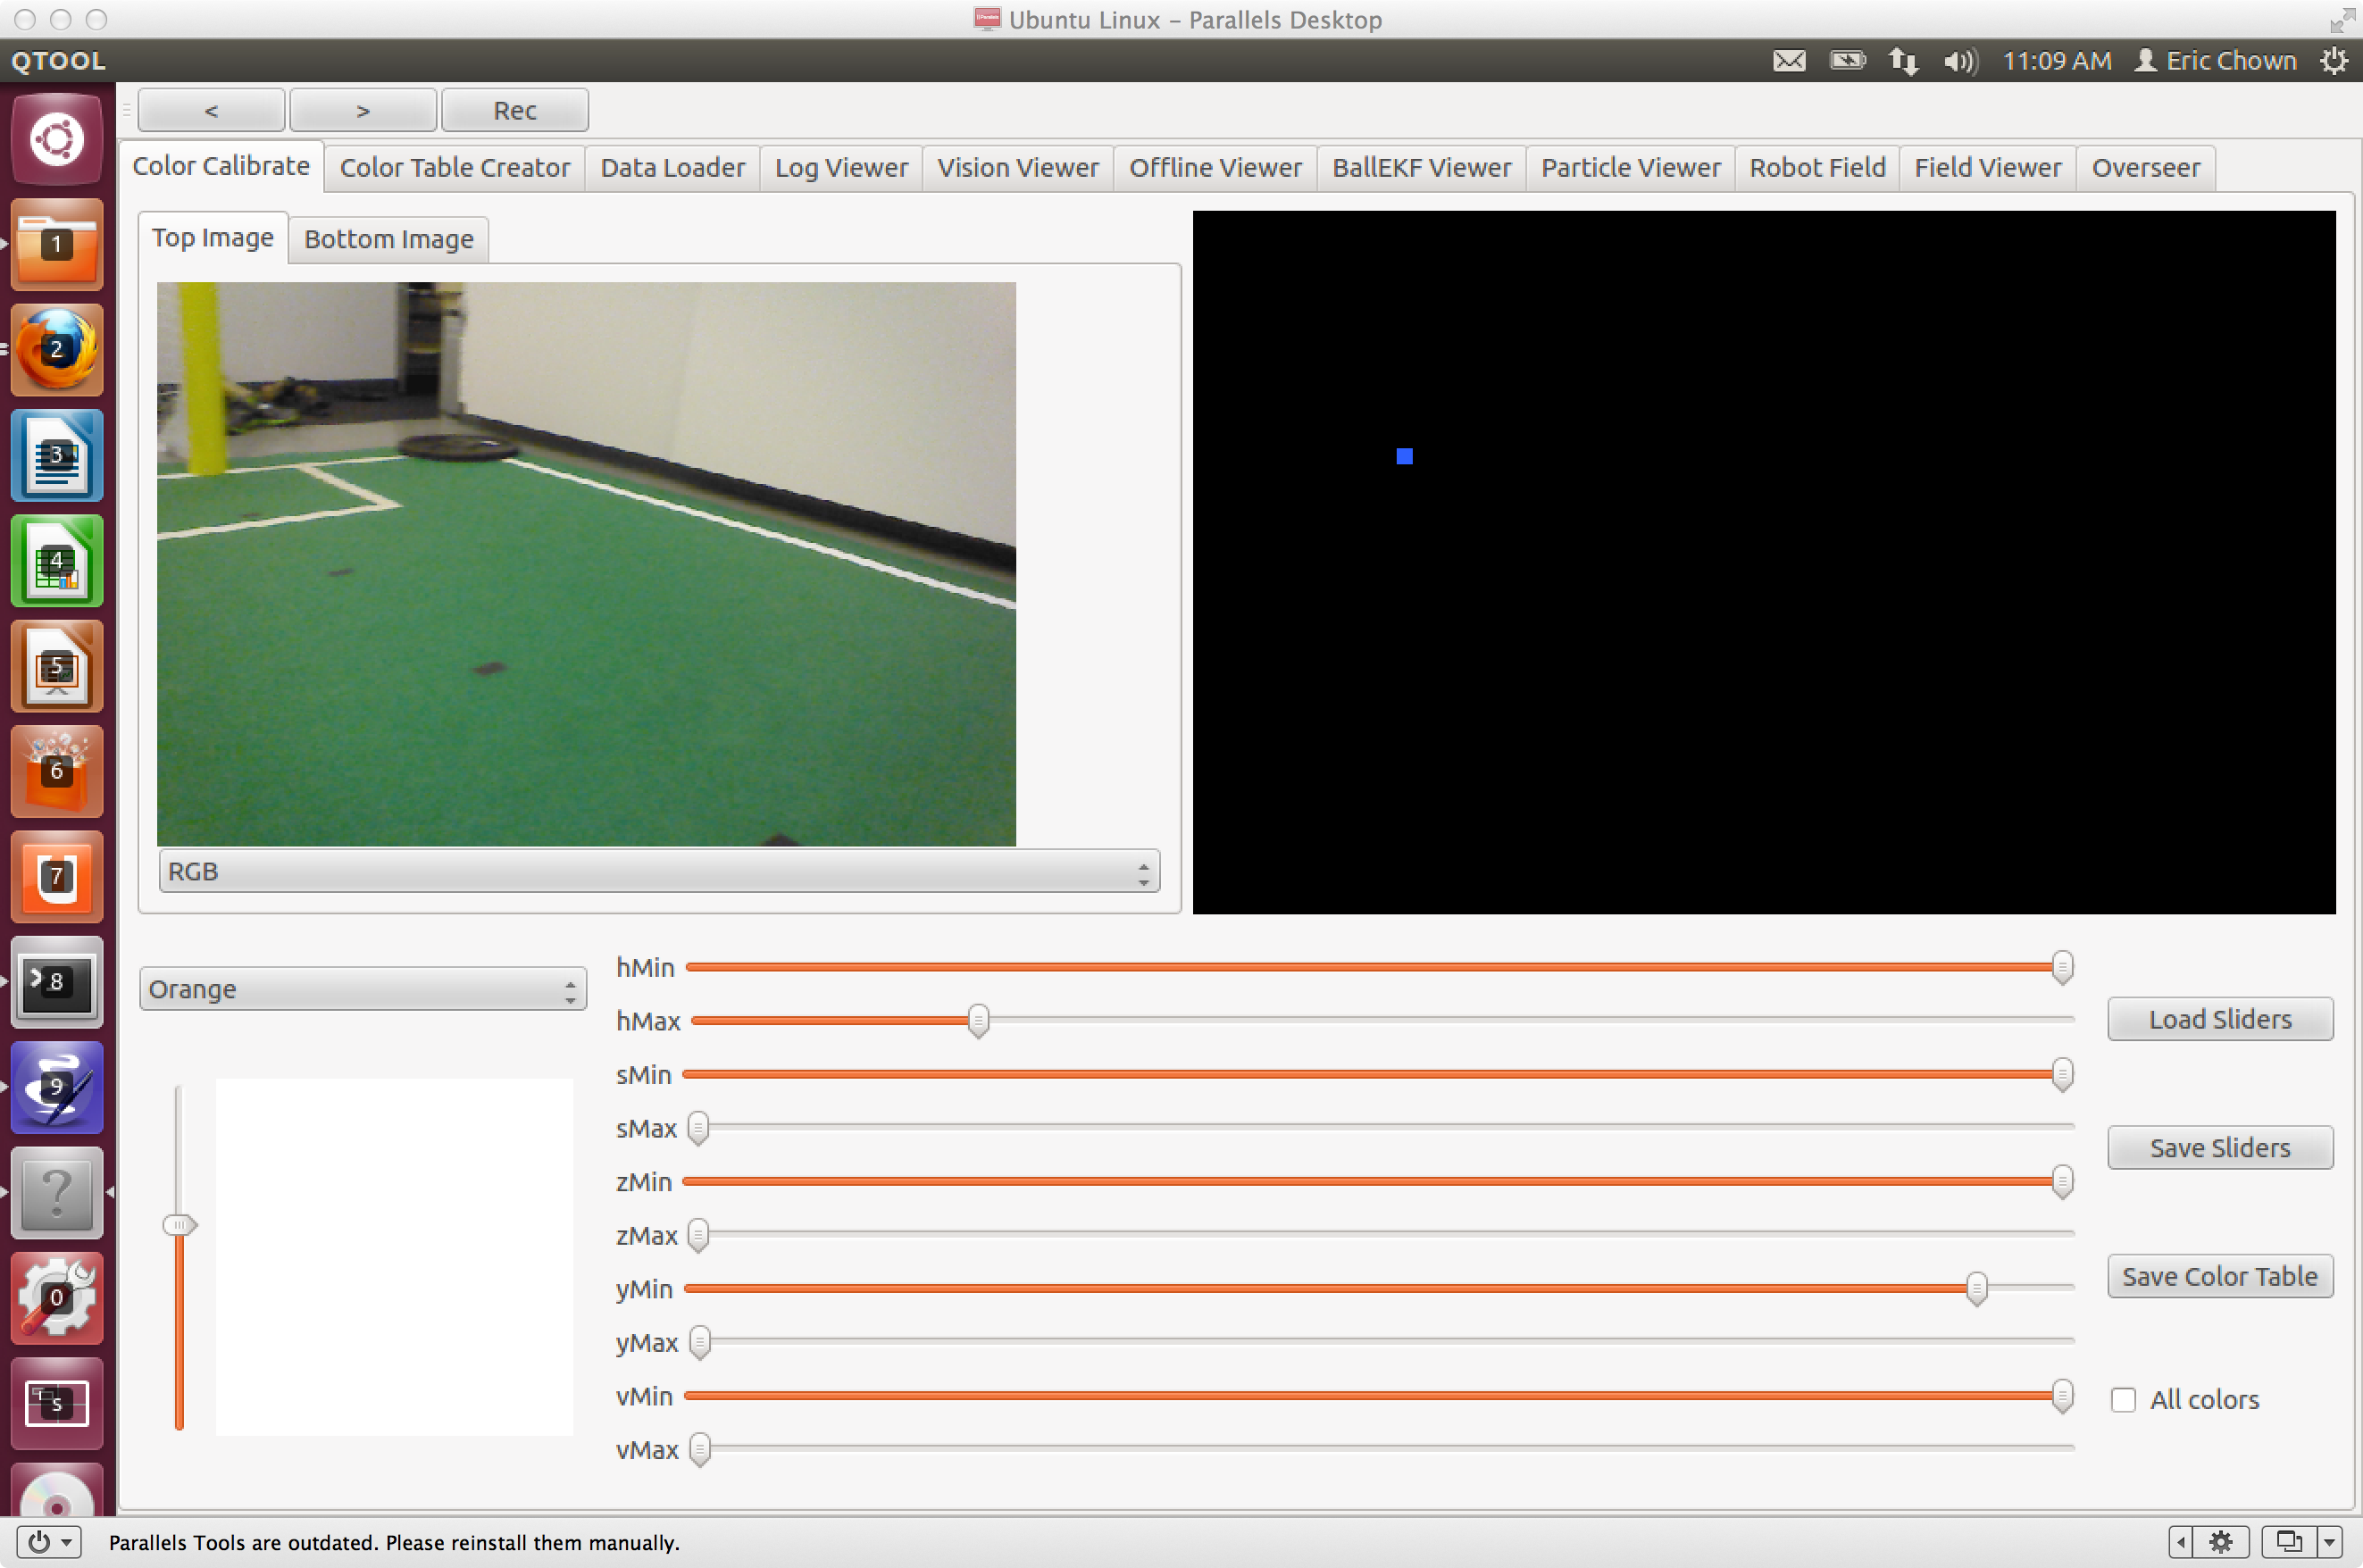
Obviously you can set the sliders manually, but these days we rarely do that (with the exception of the H sliders). The best way to set the sliders is to pick a good example of the color (i.e. a nice yellow goal post) and right-click it in the raw image. Unfortunately due to some changes in the tool what you click on in the image doesn't exactly correspond to what the qtool thinks you clicked on. This is an issue that really needs to be fixed. When you click the qtool will also mirror the click on the thresholded image to the right. This is a form of supervised learning. Essentially what you are doing is informing the color creator system that this is a good example of one of the colors. It will then use that example to alter its definition of the color if necessary. We are starting with a definition of the color that is basically empty and then your job as the person making the color table is to grow the definition by showing the tool good examples. With each new example the tool will grow the definition just enough to include the new example. Save the sliders you are working on pretty often. A stray click can muck up your table. If you save then you can reload your earlier work.
What the tool does is figure out why the corresponding pixels don't work for the color cube you are defining and it will increase the range of the cube (by adjusting the sliders) automatically. With just a few clicks you should be able to define a relatively large range in the color space. If you left-click you will see the values of where you clicked and how that pixel would be classified. As you do this you'll want to save your sliders in case you make a mistake. You can keep saving them to the same file over and over. You'll also notice when you click (either right or left) that a little blue box will be drawn on the thresholded image on the left. That's just to help you hone in on the region you are working on. Ideally we will fix this to actually mirror the cursor on both images in the future so we can easily click exactly where we want.
Keep in mind that your goal is to find the minimum space in the color cube. A rookie mistake is to try and make everything colored on every frame. Sometimes the camera just doesn't provide a good enough image, or there is an overlap between colors, or . . . The bottom line is that you want the objects pretty well painted, but sometimes you need to let them be only marginally well painted so off field objects don't start getting painted too much. In general it is much better not to recognize an object that is there than to recognize one that isn't there.
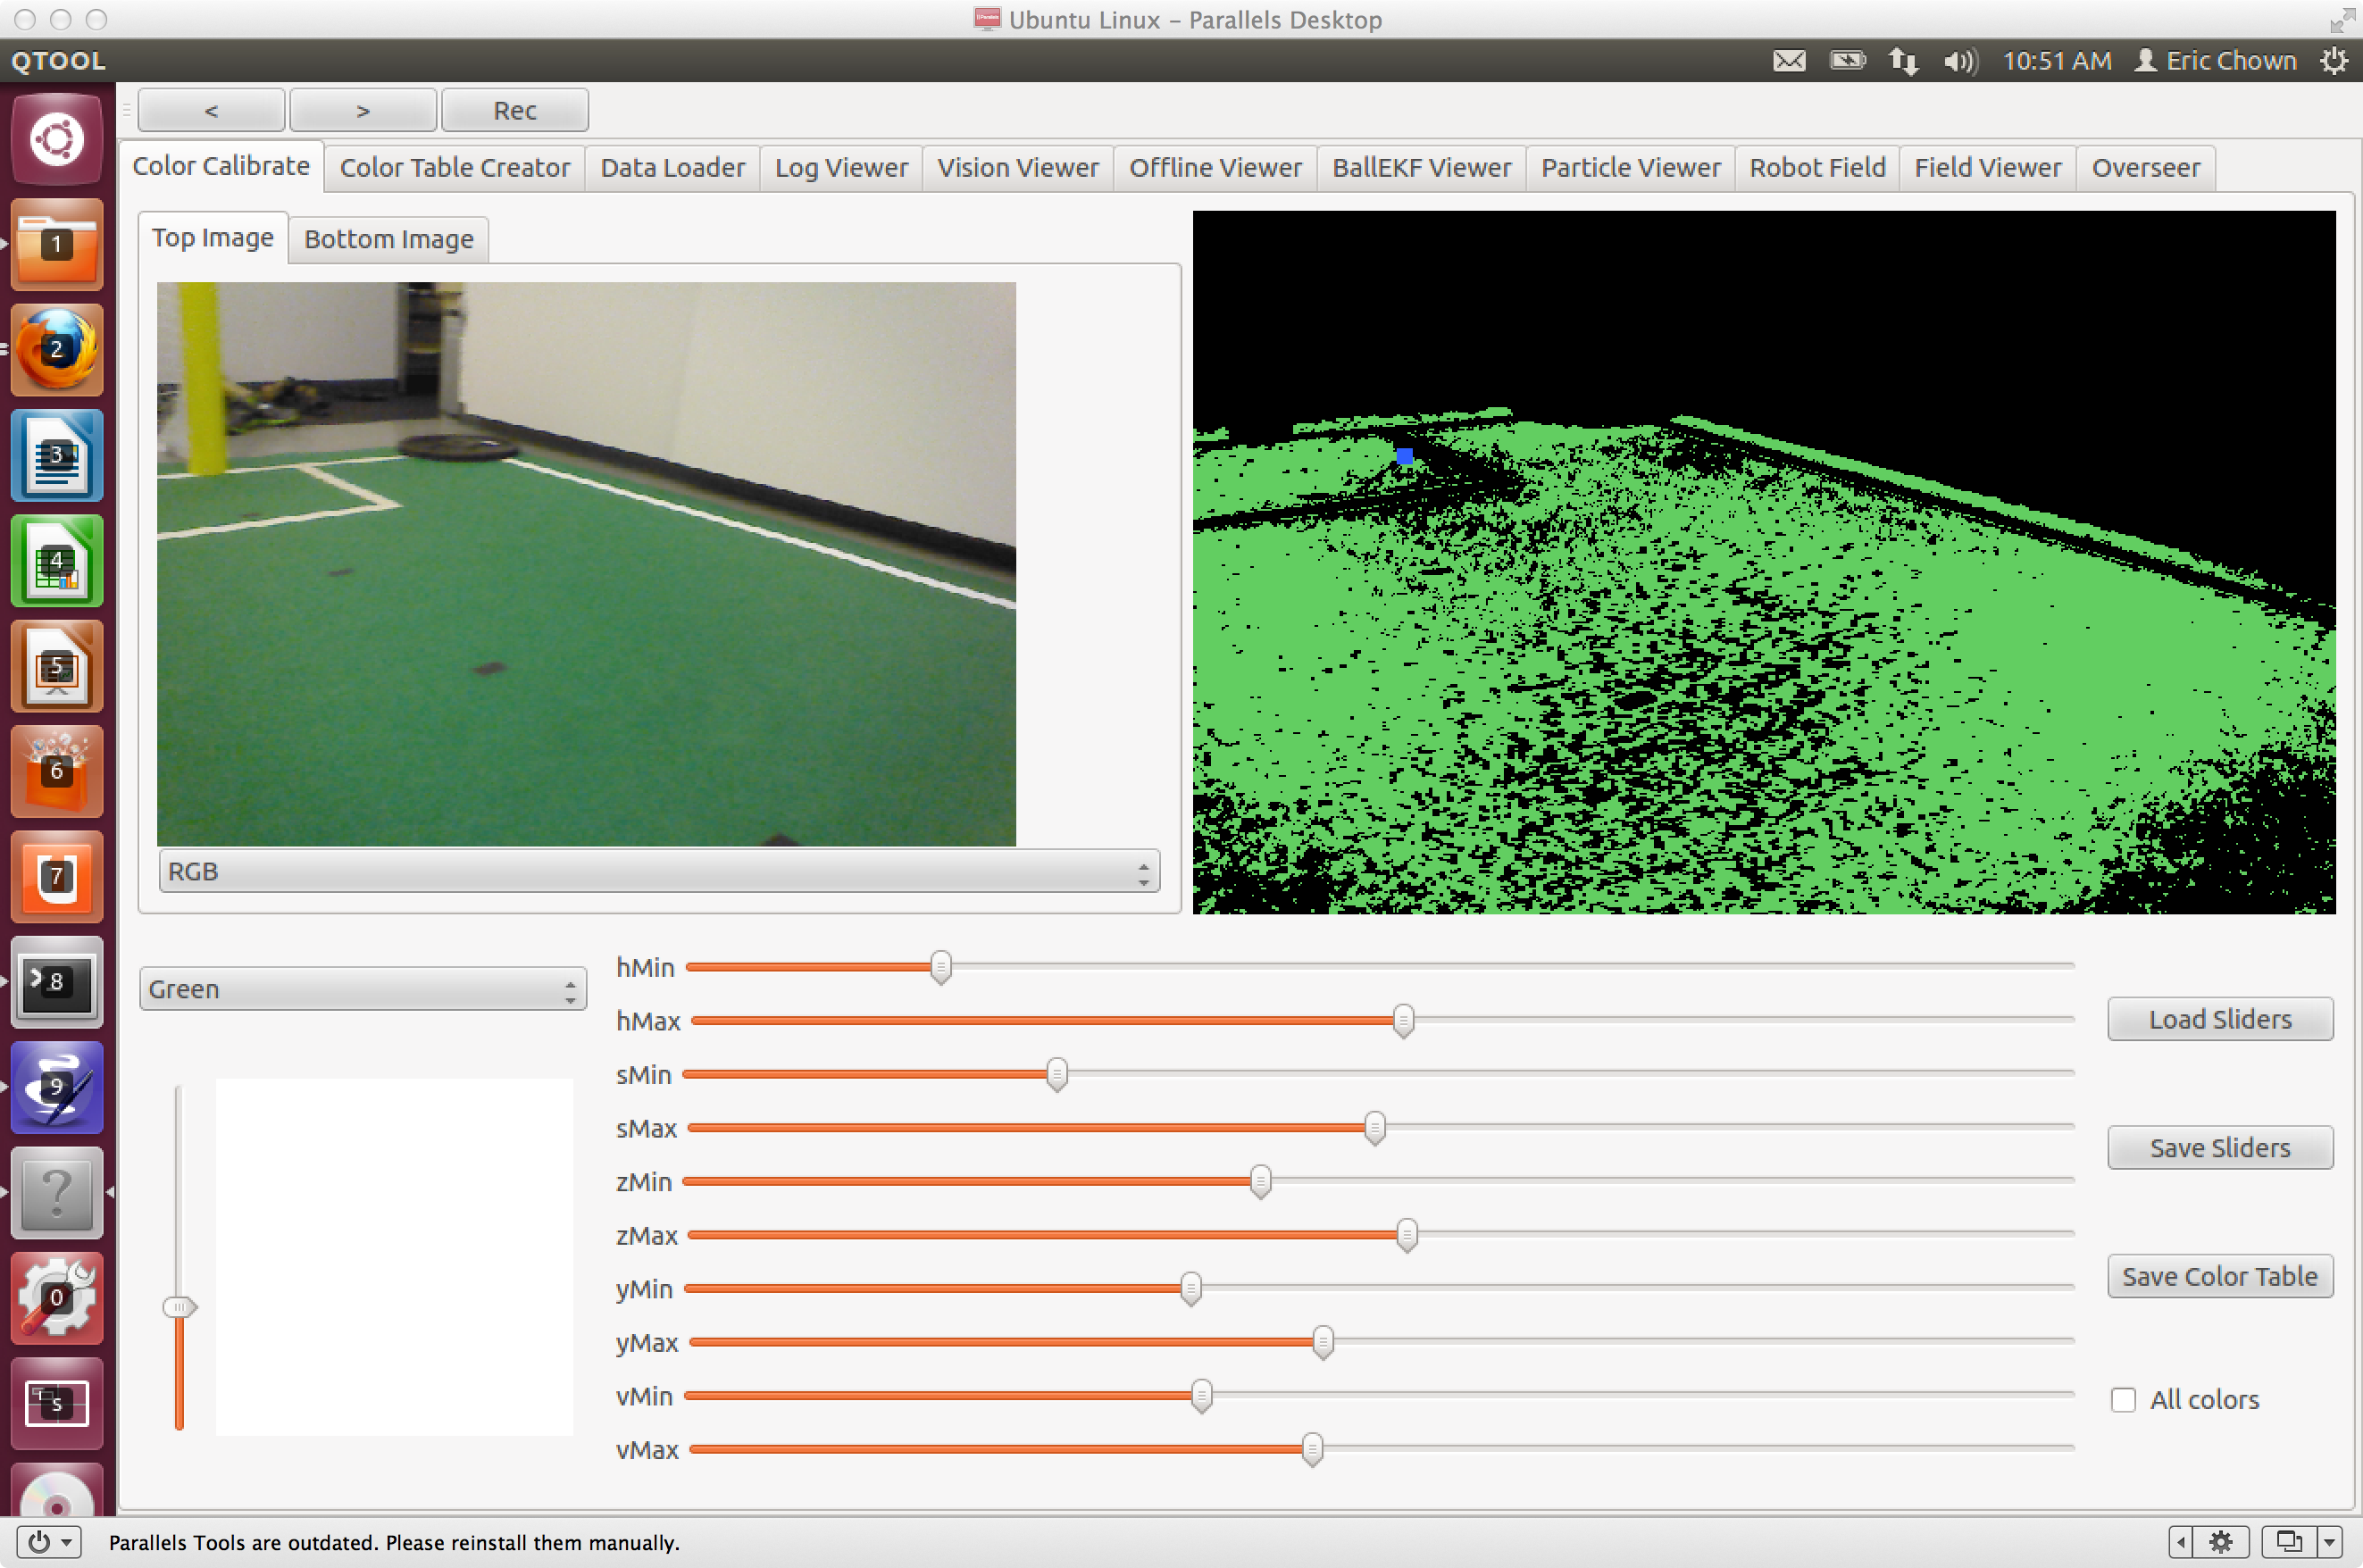
Here is an example. The GREEN here is fine for most environments. Turns out that in the lab we can make it better, but at competition we often don't want it much greener than this.
With the latest version of the Naos we now have two cameras. Ideally we would just make one color table that would work for each. In practice the cameras are a little different and they see the world a little differently (i.e. the bottom camera is looking down and generally gets a darker image and sees lots of shadows). For now we create two color tables. Our current strategy is to first build a color table for the upper camera. In general you should do this only using images from the upper camera. The one exception is with the ball. The ball is so important that it is useful to have as many orange examples as possible. Once you are happy with the upper table save it. It is reasonable from here to use your sliders for the upper table as sliders to start work on the lower table (but give them a new name). With the lower camera we're really only looking for balls and the bottoms of goal posts so it is ok to overdo your colors a bit more than for the upper camera (you won't see crowds on the sidelines with the lower camera for example). Your main goal is really to make sure that the ball is always seen and that you can see the bottom of goalposts when the robot is right next to them. So be sure that you have logs where the ball is very close to the robot, and ideally where the ball is as shadowed as possible. Also you'll need images where the posts are literally right next to the robot (again shadowing is a good thing here).
Once you have got everything the way you like it you can go on to save your color tables. If they then need to go into the repository, navigate to data/tables in the terminal and
$> ./sync up