Interpreting Citrus Output - nolanlab/citrus GitHub Wiki
This page describes how to interpret output from a Citrus analysis. Please note that at this time, this document is a work in progress.
The following describes a typical Citrus analysis:
- A hierarchy of phenotypically-similar cellular subsets is identified using hierarchical clustering
- Properties of identified clusters are calculated on a per-sample basis
- One or more statistical models is used to detect associations between calculated cluster properties and an experimental endpoint.
The output of a Citrus analysis is a record of cluster properties that are associated (to some degree of certainty) with the experiment endpoint and plots that allow you to determine the phenotype of the stratifying cluster.
Interpretation the output of a Citrus analysis generally consists of 3 steps. Specifically, the user must:
- Determine if the associations detected between cluster properties and experimental endpoints meet desired statistical significance requirements.
- View the relationship between significant cluster properties and the experimental endpoint.
- Determine the phenotype of the clusters from which significant cluster properties were calculated.
In words, Citrus uses one or more statistical models to determine associations between cluster properties and the experimental endpoint. The user must decide if the strength of detected associations is acceptable for their purposes. If not, no further inspection of the results is needed. See Determining model significance for details on assessing the significance of results. If the model meets minimum significance requirements, the user should then inspect the feature plots produced by Citrus that show the relationship between significant cluster properties and the experimental endpoint. Finally, the user should look at plots of the clustering hierarchy and cluster marker expression to determine 1) the phenotype of significant clusters and 2) the relationship between significant clusters.
For the remainder of this document, we will use the output of Example 1 for illustrative purposes.
When the Citrus analysis has finished running, navigate to the directory that contain the source FCS files and open the 'citrusOuptut' directory. In this directory you will find the following files:
- citrusClustering.rData
- A saved version of the clustered data that was computed during this analysis.
- runCitrus.R
- A file with R code that was run for this analysis. If you wish to re-run the analysis without the GUI, you may open and run this file directly.
- citrusOutput.log
- A file that contains R output from the analysis. Helpful for debugging.
- Condition result directory
- A data directory that contains results of an analyzed condition. There will be one condition result directory for each analyzed experimental condition. Directories are named with the convention {condition name}Condition. If you did not specify any experimental conditions in the analysis, you will see a directory called "defaultCondition".
Navigate to a condition result directory. Within a condition result directory you will find:
- MarkerPlots.pdf
- Plots of the clustering hierarchy, one marker per pdf. Helpful for determining the phenotype of identified clusters. See discussion of interpreting clustering hierarchy plots for details.
- MarkerPlotsAll.pdf
- Same content as MarkerPlots.pdf in a single PDF instead of many.
- Model result directory
- A directory containing results from model analysis. There will be one result for each model used to analyze the data. All models operate on the same clustering result.
Navigate to a model result directory. Within a mode result directory you will find:
- clusters-{threshold}.pdf
- Shows phenotype of stratifying clusters at specified significance threshold.
- features-{threshold}.pdf
- Plot showing values stratifying features at specified significance threshold.
- features-{threshold}.csv
- Raw values of stratifying features at specified significance threshold.
- featurePlots-{thresholds.pdf}
- Shows the the location and relatedness of identified stratifying clusters in the clustering hierarchy. There will be a separate plot for each tested feature.
- ModelErrorRate.pdf
- Used to determine the accuracy of the constructed model. For predictive models only (PAMR and GLMNET). See discussion of determining model significance for further details.
Citrus uses two types of models, predictive and correlative, to detect associations between cluster properties and experimental endpoints. Assessment of model significance is different for these two model types.
The predictive models employed by Citrus identify cluster properties that are the best predictors of the experimental endpoint. In practice, Citrus creates a series of predictive models, each having a varying number of cluster properties, and then uses cross validation to assess the predictive accuracy of each model. The output of this process is a plot that shows the estimated error rate of each model as determined by cross validation. This plot is found in the file ModelErrorRate.pdf.
The following is an example of a model error rate plot.
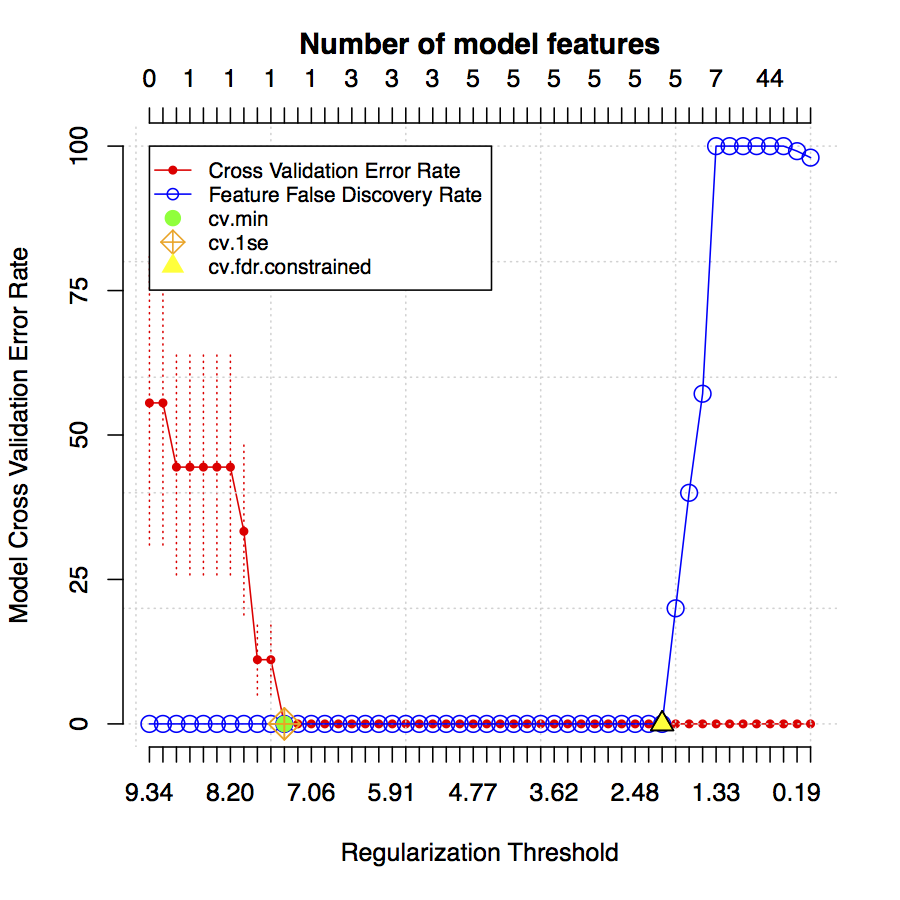 The red dots/line show the estimated model error rate for predictive models created at different regularization thresholds. Model estimated error rates go from 0% (perfect predictive power) to 100%. The dotted red vertical lines extending from each red dot indicate the standard error of the estimated error rates. The blue line indicates the estimated feature false discovery rate (from 0 to 100%) for each model. Models containing fewer cluster properties are found on the left side of the plot while models with more are on the right.
Citrus reports features for several pre-selecte models based on error and false discovery rates.
- Minimum Error Rate Model
- Labeled as cv.min and marked with a solid green dot. This is the simplest model having the lowest estimated error rate.
- 1-Standard Error Rate Model
- Labeled as cv.1se and marked with a crossed green diamond. This is the simplest model having an error rate within 1 standard error of the minimum. If the cv.1se model is the null model (i.e. contains 0 features), it is unlikely that cluster properties calculated by Citrus explain any variance in the experimental endpoint.
- FDR-Constrained Model
- Labeled as cv.fdr.constrained and marked with a yellow triangle. This is the model that contains the most number of features while maintaining an estimated feature false discovery rate of < 1%.
The user should look at the estimated model error rates and decide if any of the predictive models constructed by Citrus meet minimum accuracy requirements. For example, cross validation may suggest that a the cv.1se model can correctly predict the experimental class of a sample 75% of the time. This accuracy may be acceptable in some situations but not in others. If the model does indeed meet necessary accuracy levels, the user should further examine the predictive cluster properties identified by Citrus and the phenotype of each predictive cluster. Otherwise, all other analysis output should be ignored.
To Do
To Do
To Do