Data Comparison Tool - nickcounts/MDRT GitHub Wiki
Introduction and Quick Start Guide to MDRT Data Comparison Tool
Overview
The MDRT Data Comparison Tool (currently in beta) is an interface that allows users to quickly and easily create plots comparing any two data sets that have been processed and indexed. The beta release introduces some exciting new features:
- Searchable List of Available FDs (this is really cool)
- Double-click to add or remove an FD
- Easy selection of available data sets
- Automatic sub-plot title generation (can be edited before saving)
- Can synchronize times to any timeline milestone or T-0 on either data set (this is also really cool)
Setting up a Comparison Plot
Lets get started!
From the MDRT main interface, click the Data Comparison Tool button (it is light red, indicating a beta feature)
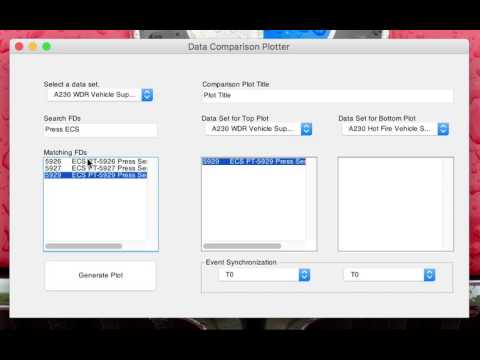
This will launch the Data Comparison Tool, and you will see the following interface:
images/MDRT-comparison-plotter-beta-v0.4.3.png
Choosing Operations to Compare
MDRT Data Comparison Tool loads an index of available data sets and automatically populates the "Data Set for Top Plot" and "Data Set for Bottom Plot" drop-down menus. If the operation you want to compare is not in the list it is either unavailable, or its indexing has not been finalized. See the MDRT Data Archive Manager tool for more on this topic.
When a data set is assigned to one of the plots, the list of Data Sets above the Search FDs and Matching FDs tools is updated automatically.
Selecting an FD to Add to the Plot!
FD Selection takes place on the left-hand side of the tool. First pick the data you want to browse by using the Select a data set dropdown.
The list of Matching FDs will update with the contents of that data set. Note that any search terms in the Search FDs_ box will be applied. When first selecting a plot, the search box is empty and all FDs are displayed.
Finding the data you want has never been easier! Simply type any part of the FD you are looking for, in any order, and without concern for capitalization. The tool will filter as you type get you the data you are looking for.
Click the image for a video demonstration
Simply double-click the FD you want, and it will be added to the appropriate plot. If you want to remove an FD from a plot, double click in the plot's FD list to remove.
Plotting Your Comparison
After you have chosen your FDs, select any two Timeline Milestones from the dropdown menus below the plot FD lists. By default, T-0 is selected for data sets containing a T-O. These controls allow you to align any events in the data set for comparison.
Input a title for your plot, and click "Generate Plot"
Exploring the Comparison Plot
Comparison Plots have the same options as normal data review plots. Plot exploration tools are covered in another section, but the following is a brief list of features:
- Toolbar buttons to toggle timeline visibility, text size, and to refresh timeline events to fix display issues.
- Zoom buttons with right-click context menus. These let you zoom freely, in only one axis, or return to the original view.
- Data Cursor button allows you to place a marker on a data point that notes the value and time (to the millisecond).
- Data brushing and many other features are available for additional analysis at the command line.
- The Edit Plot tool (looks like an arrow) allows selecting any plot element and editing it. With this tool you can change line colors and styles, edit text on the plot, delete unwanted items, specify axis limits, and much more.
Saving the Comparison Plot
At this time, the preferred method of saving plots is by clicking the Save icon in the toolbar.
Using File -> Save/Save As is available, but not fully supported. Plots generated this way are inconsistent with style, aspect ratio, resolution, font sizes, etc.