Smart Money Technique Divergence - newsqlguru/ict-index GitHub Wiki
Smart Money Technique - Correlated Asset Divergence
- Video References
-
ICT Forex - The ICT Smart Money Technique or SMT
-
ICT Mentorship Core Content - Month 10 - Index Futures - AM Trend
-
ICT Mentorship Core Content - Month 10 - Index Futures - PM Trend
-
tldr
Smart Money Technique Index Divergence (SMT Divergence) is not a timing or indication tool, it is a confirmation tool. Use it to confirm or build confluence with multiple indications of price action.
-
Smart Money is unable to hide manipulation when their positions cause divergence between assets with a known correlation.
- We look for divergence to know when Smart Money is entering the market.
- https://youtu.be/i8xt0EQDjNY?list=PLVgHx4Z63paZ0R9gMaq0y2fM_2vyNJadp&t=2207
- SMT requires a narrative, it is not used in isolation, it's used in confluence with other concepts.
- i.e. SMT Divergence is detected after price as moved above higher highs or below lower lows at key levels, during an Smart Money Reversal (SMR) within a Market Maker Buy/Sell Model.
-
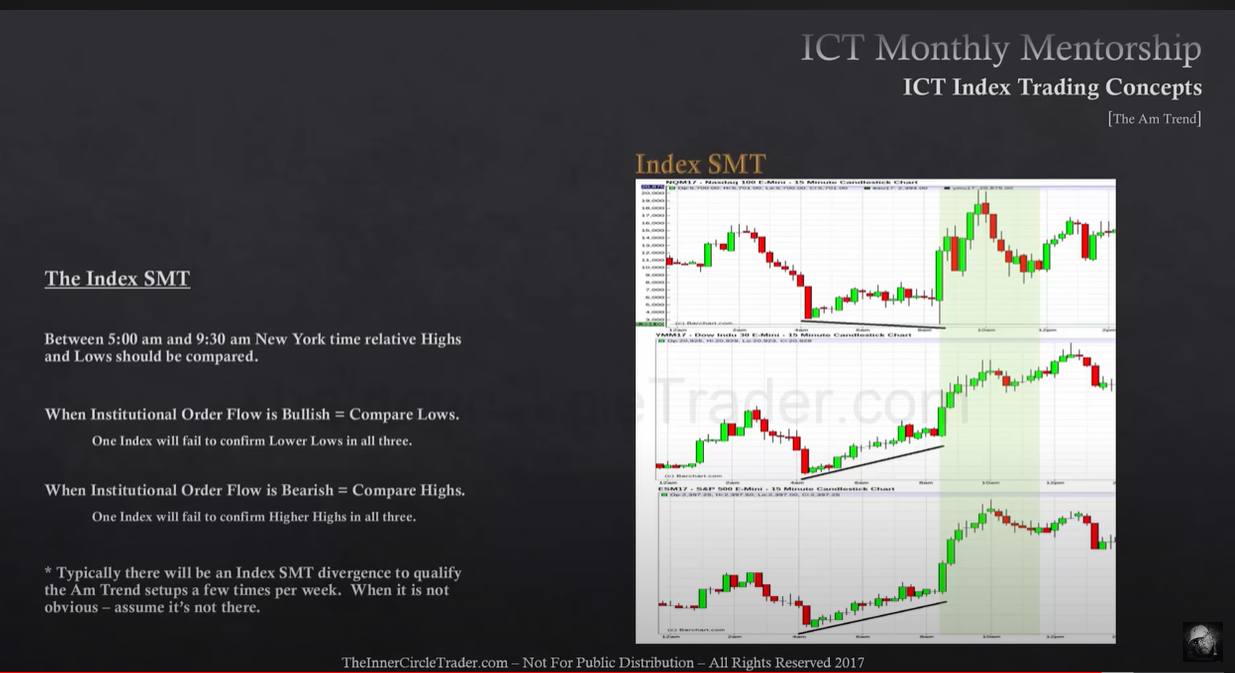
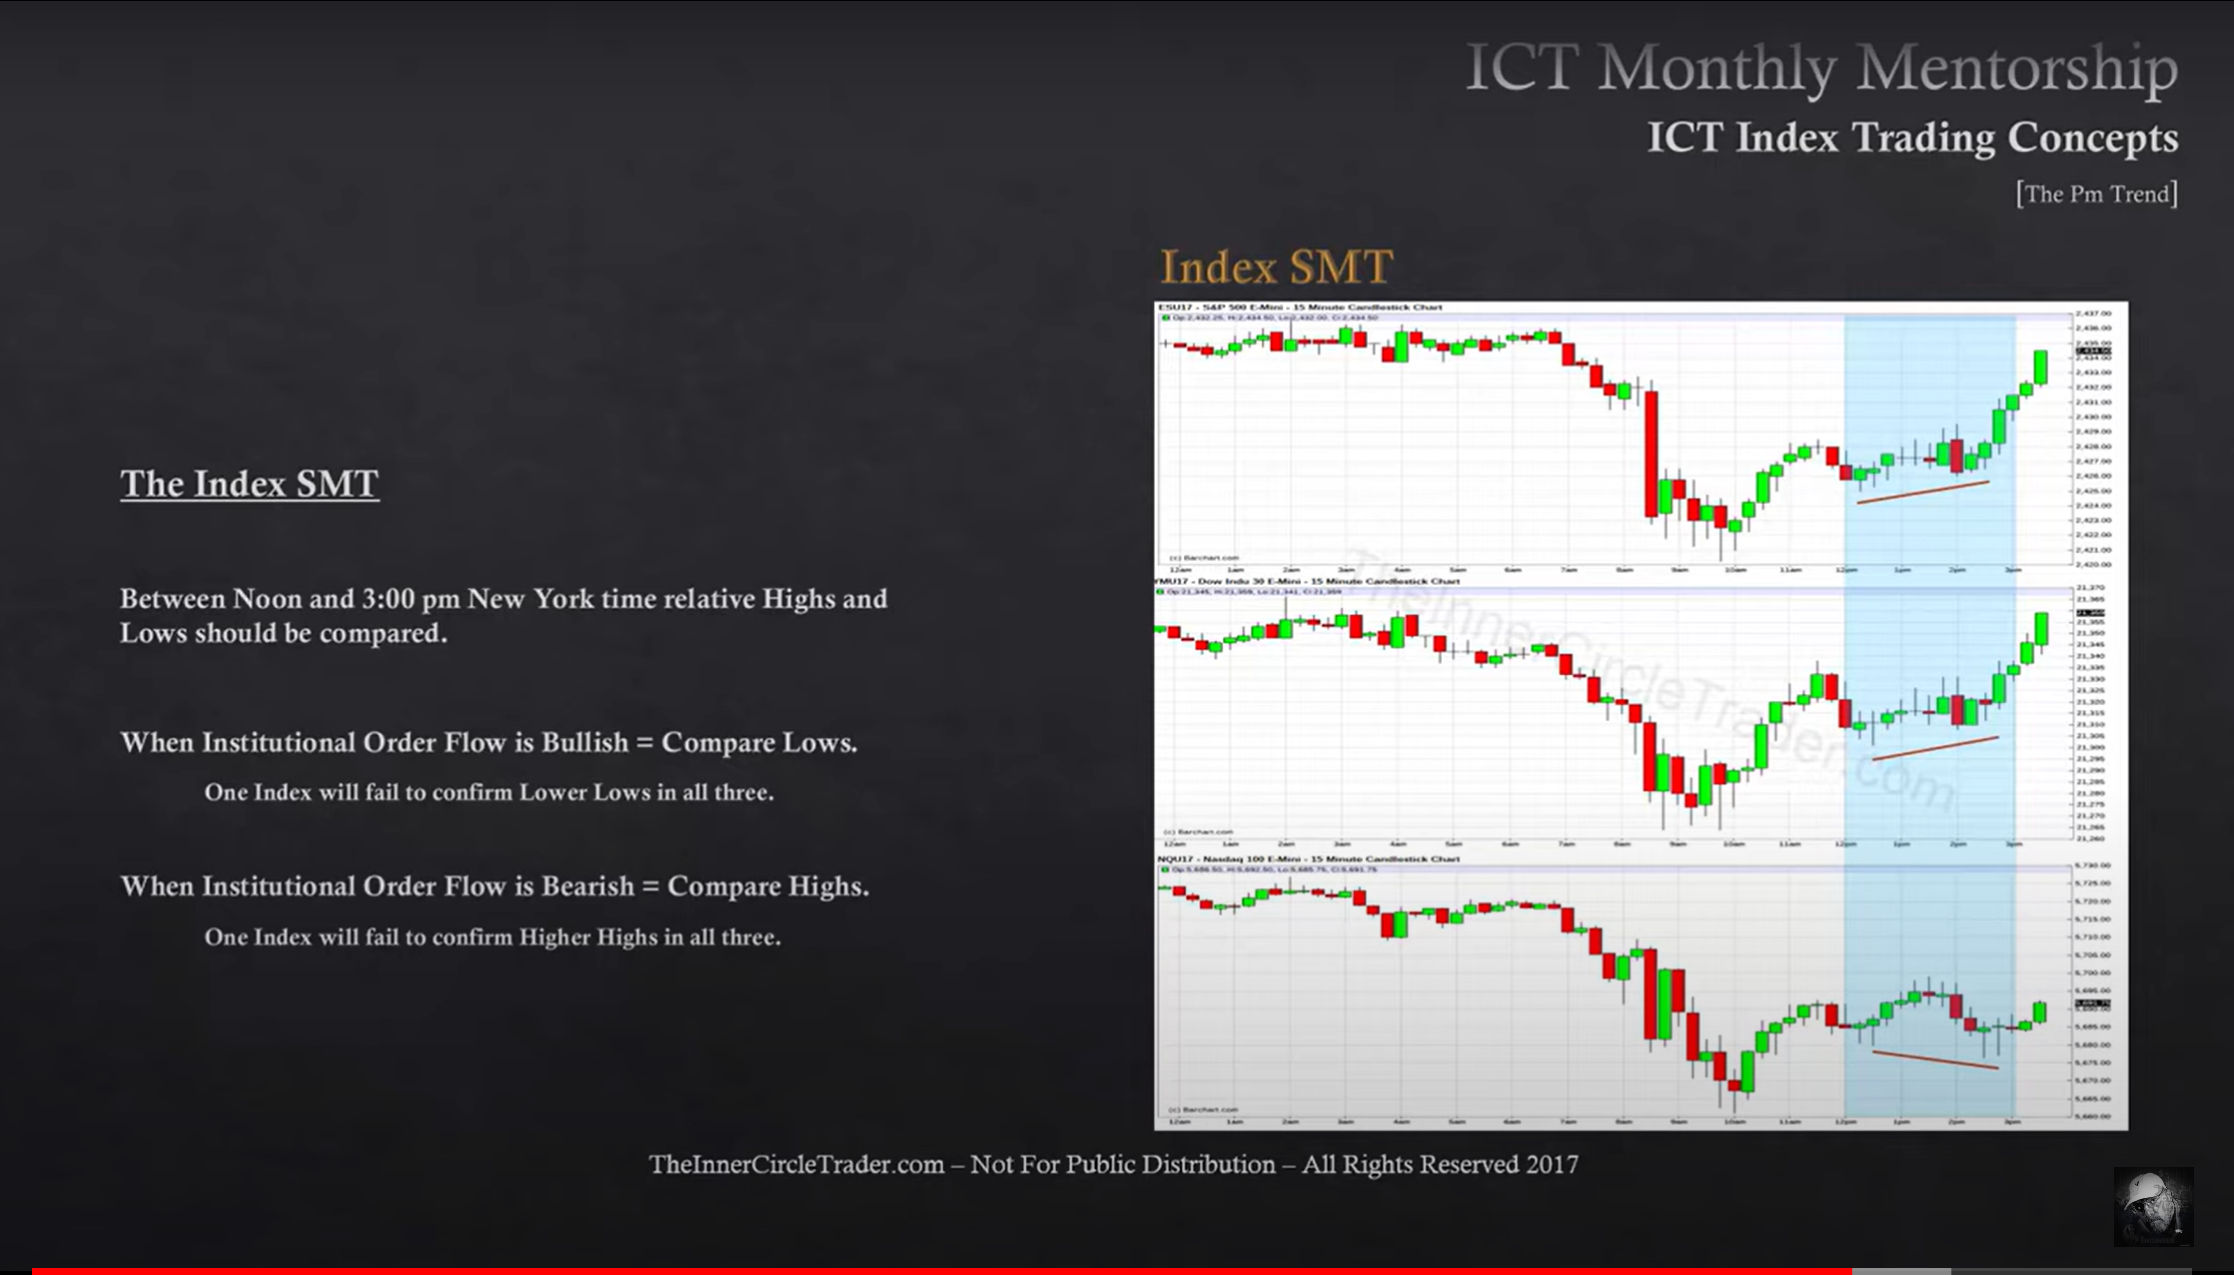
Index Divergence
- Compare NQ, YM, ES, & DXY for price divergence.
-
Between 05:00-09:30 EST.
- Compare relative highs and lows.
-
Between 12:00-15:00 EST.
- Compare relative highs and lows.
-
When Institutional Order Flow is Bullish = Compare Lows.
- One index will fail to confirm Lower Lows in all three.
-
When Institutional Order Flow is Bearish = Compare Highs.
- One index will fail to confirm Higher Highs in all three.
-
(Smart Money Technique) SMT Divergence, compares correlated assets to find "cracks in correlation", when these assets don't follow correlation and diverge in price action this is an indication of manipulation by Smart Money.
-
When looking for SMT Divergence, we are looking at the assets on the same time frame and the same date time.
-
SMT Divergence can be applied to Bullish and Bearish markets and can be found with positive and negative correlated assets.
-
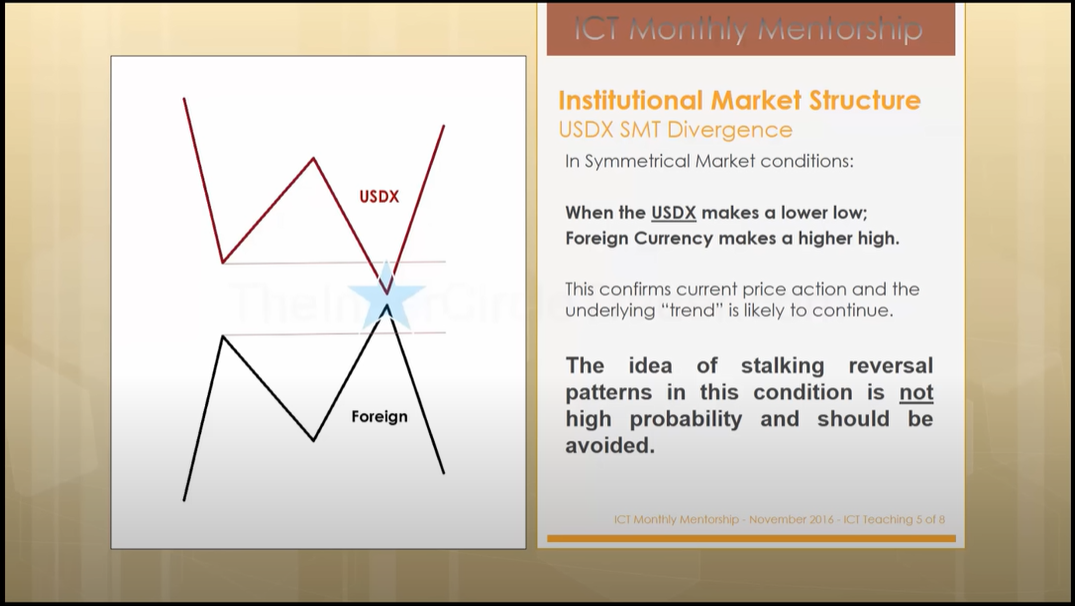
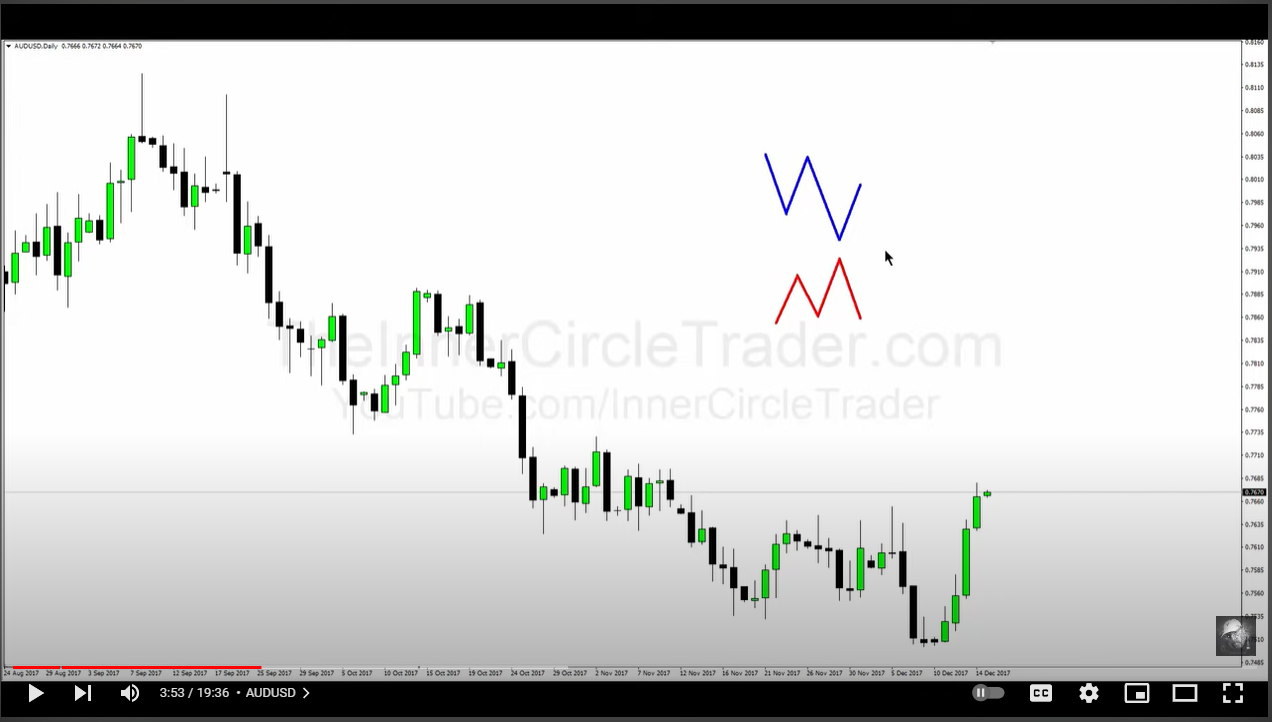
Correlated assets create a "Symmetrical Market" when correlation is under normal conditions.
-
In the case of a positive correlation (0..1) the assets will move in the same direction, a higher high in one asset will result in a higher high in the correlated asset.
-
In the case of a negative correlation (0..-1) the assets will move in the opposite direction, a higher high in one asset will result in a lower low in the correlated asset.
-
-
We look for cracks in correlation, giving us an indication that SMT is in play.
-
When an asset fails to make a lower low it is being bought up to support it's price.
-
When an asset fails to make a higher high it is being sold up to repress it's price.
-
When the market is symmetrical and there is no divergence in correlation, reversals are not high probability trades. Stalking a reversal should be avoided as the symmetrical market confirms the trend is most likely to continue.
-
We can anticipate a "Turtle Soup" price action in a symmetrical market.
-
Symmetrical markets confirm price, any moves below old highs/lows are a liquidity raid in preparation for trend continuation.
-
Non-Symmetrical markets provide high probabilities for reversal trades.
-
These market conditions confirm the market trend will change rather than continue.