2022 Mentorship Episode 02 - newsqlguru/ict-index GitHub Wiki
-
Top Down Approach, review price action starting on the higher time frame of our preferred trading style, we are building a narrative that helps us determine bias. The goal is to determine which way will price move based on our understanding of market conditions.
- e.g.
- If we are targeting long term trades, we would develop a narrative for bias on the Yearly, Quarterly, and Monthly charts.
- If we are targeting swing trades, we would develop a narrative for bias on the Monthly, Weekly, and Daily charts.
- If we are targeting intraday trades, we would develop a narrative for bias on the Weekly, Daily, and 4 Hour charts.
- e.g.
-
Before the next time frame begins, we observe price action on the time price going to go higher or lower?
- It is important that we do not try to predict the close of the time frame, only the direction.
-
Transpose higher time frame points of interest to lower time frames.
- Highs, Lows, Imbalances.
| Time Frame Chart | Analysis Time | Factors of Importance | Draw on Liquidity | Directional Bias |
|---|---|---|---|---|
| Weekly | Before start of week | Seasonality? Fed Interest Rate Stance? Earning Season? Volatility? Market Sentiment? |
Weekly High/Low? Imbalances? |
Up? Down? Neutral? |
| Daily | Before start of day | Weekly High/Low? Daily Swing Highs/Lows? Weekly Dealing Range Position? Day of Week? |
Short-term Highs/Lows? Imbalances? |
Up? Down? Neutral? |
| Hourly | Before start of day | Daily High/Low? Hourly Swing Highs/Lows? Daily Dealing Range Position? |
Short-term Highs/Lows? Imbalances? |
Up? Down? Neutral? |
-
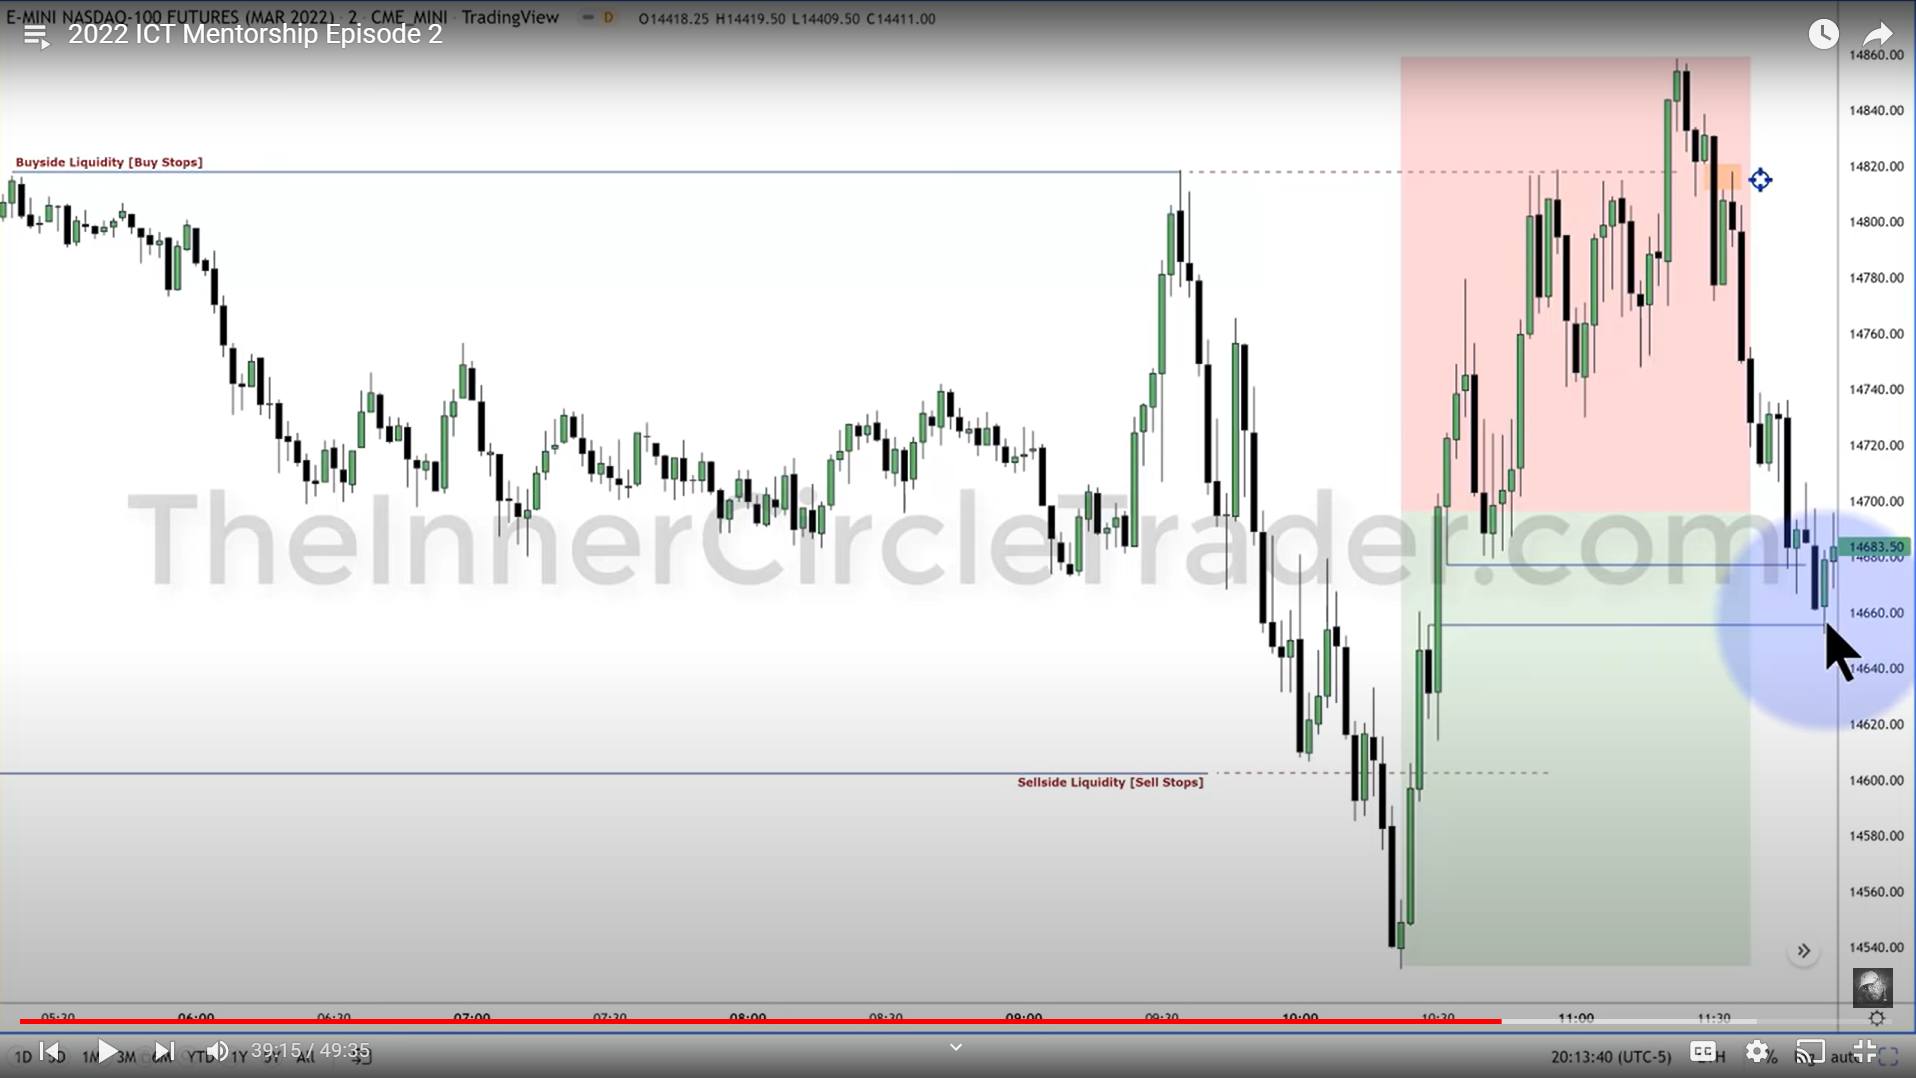
When a significant price move lower is expected always anticipate some measure of stop hunt on short term highs, taking out Buy Side Liquidity (BSL).
-
When a significant price move higher is expected always anticipate some measure of stop hunt on short term lows, taking out Sell Side Liquidity (SSL).
-
Run on liquidity, buy stops or sell stops at old highs/lows are run and taken.
-
Larger liquidity pools exist at equal highs/lows and relatively equal highs/lows.
- Handle, is the round dollar number of the index.
- i.e. ES has $0.25 ticks per dollar or 4 ticks per handle. ES is priced at $12.50 per tick or $50.00 per handle.
- Measure the Dealing Range, recent highest high to lowest low of the time frame.
- Premium Market, above 50%
- Equilibrium 50%
- Discount Market, below 50%
- Focus on time frame 08:30 - 11:00 EST for optimal setups
-
Bullish
- Is price in a Discount Market?
- Have Sell Stops been attacked with a run on SSL?
- Is there a Break of Structure (BOS), in the form of a Swing High for a bullish BOS?
- Is there a Displacement of Price, a large dynamic energetic candle that breaks higher than the prior Swing High?
- Has a Fair Value Gap (FVG) been created by displacement, an imbalance in price delivery to one side, in this case buy side.
- Possible Trade Entry on retracement into FVG, when price trades into the FVG a long trade can be entered.
- Alternative trade entry if FVG retracement is missed, after retracement and before price breaks above the displacement high, a buy order can be placed at the top of the displacement candle with a stop loss at the top (high) of the FVG.
- Take Profit Exit, target the Premium Market for trade exit, when price moves above 50% consider an exit or partial exit.
-
Bearish
- Is price in a Premium Market?
- Have Buy Stops been attacked with a run on BSL?
- Is there a Break of Structure (BOS), in the form of a Swing Low for a bearish BOS?
- Is there a Displacement of Price, a large dynamic energetic candle that breaks lower than the prior Swing Low?
- Has a Fair Value Gap been created by displacement, an imbalance in price delivery to one side, in this case sell side.
- Possible Trade Entry on retracement into FVG, when price trades into the FVG a short trade can be entered.
- Alternative trade entry if FVG retracement is missed, after retracement and before price breaks below the displacement low, a sell stop can be placed at the bottom of the displacement candle with a stop loss at the bottom (low) of the FVG.
- Take Profit Exit, target the Discount Market for trade exit, when price moves below 50% consider an exit or partial exit.
- Back test intraday charts 4h, 1h, 15m, 5m, 4m, 3m, 2m, 1m. Find BOS after a run on BSL/SSL, in an opposing direction of the weekly range.
- Find liquidity raids, run on a pool of liquidity.
- If weekly bias is bullish look for a liquidity run below an old low.
- If weekly bias is bearish look for a liquidity run above an old high.
- After the liquidity run as formed, move to a lower time frame to find BOS.
- When a BOS has been created, find an imbalance for possible trade entry.
- Create a dealing range for the time frame, from most recent highest high and lowest low.
- Split the range at 50%, target the first Point of Interest in the opposite market as the trade exit target.
- Target the old high/low or first imbalance over or under 50% as the trade exit, do not try to target the full range.
- Record the trade details for review, entry, number of handles, exit.
- Calculate the number of trades and handles per week.