Visualization - newlife-js/Wiki GitHub Wiki
by 서울대학교 컴퓨터공학부 서진욱 교수
Marks and Channels
Mark: Basic graphical element
공간 차원에 따른 분류
- Point(0D)
- Line(1D)
- Area(2D)
- Volume(3D)
Geometric primitives
- Marks as Items/Nodes: Point, Line, Area
- Marks as Links: Containment, Connection
Channels: way to control the appearance of marks
spatial dimensionality와는 independent함.
- Position
- Color
- Shape
- Tilt
- Size
expressiveness principle
match channel and data characteristics
effectiveness principle
encode most important attributes with highest ranked channels
rankings
- accuracy
- discriminability
- separability: channel간 정보의 구분이 잘 되는지
- popout: 다른 점을 빠르게 지각할 수 있는지(Preattentive perception)

Grouping 방법(by Gestalt Psychology)
Containment, Connection, Identity Channels(Proximity:Spatial region / Similarity:Color hue, Motion, Shape)
Perception and Visual Patterns
Gestalt Laws
전체는 부분의 합과 다르다
가장 해석하기 쉬운 대로 해석함(Law of Pragnanz)


Grouping(Gestalt Principle)
proximity(가까이 있는 것끼리), similarity(비슷한 것끼리), continuity(연속적이고 부드럽게 이어지도록), Common fate(같이 움직이는 것끼리)
Perception of Forms
- closer: form complete, closed figures to increase regularity(삼각형이 존재하는 것처럼..)
- Area/Figure and Ground/Relative size: smaller one as figure, larger one as ground(작은 게 앞에 나와있는 것, 큰 것은 배경)
- Symmetry: 물체들을 symmetrical shape로 지각함
Human Visual System
Fixation-Saccade cycle
fixation과 saccade가 1초에 3~4번씩 반복됨
- fixation: brief stationary period when detail information is acquired
- saccade: flicking rapidly to a new location during a brief period of blindness
Postattentive Amnesia
미리 물체들을 보여주고, search를 하게 해도 별 도움이 되지 않는다..
Preattentive Task
200-250ms만에 feature를 detect하는 task
- target detection, boundary detection, region tracking, counting and estimation
- 이를 잘 이용해서 user의 주의를 원하는 방향으로 끌고 가는 것이 중요
Color
우리 눈은 절대적 밝기나 색을 인지(not light meters)하기보다는 difference in signal을 인지함(change meters)
Color Space
- RGB: Red, Green, Blue
- HSL: Hue, Saturation, Lightness
- HSV: Hue, Saturation, Value
- CIEXYZ -> 3 independent channel로 색을 표현함(Trichromacy)
Multidimensional Data Visualizations
3 variables까지는 표현하기 쉽지만 그 이상은 쉽지 않음
3D도 2D에 표현하려는 여러 방법 존재
Glyphs
a graphical object designed to convey multiple data values
Chernoff Faces
Encode different variables' values in characteristics of human face

Table Lens
SpreadSheet을 더 visual and symbolic하게 만든 것

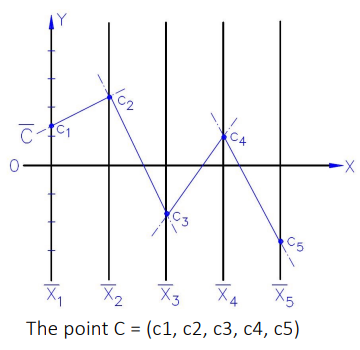
Parallel Coordinates Plot(PCP)
각 수직선을 각 variable의 축으로 두고, 각 수직선에 대응되는 값을 선으로 연결
Angular Histogram(AH), Parallel Histogram Plot(PCP + AH)

Star Plot(Radar Chart)
360도를 각 등분하여 각각의 variable(spoke)가 나타내는 값끼리 연결
Star Coordinates
star plot과 비슷하지만 variable별 값을 가중치 accumulation해서 표시

High-dimensional Data Visualizations
기존의 conventional multi-dimensional visualization으로 표현하기 힘든 데이터를 visualization하는 방법
Scatterplot Matrix(SPLOM)
기존의 SPLOM으로는 n이 커지면 unscalable해지기 때문에, reorder & abstraction해서 pattern을 표현함
Multidimensional Projections(MDP)
Multidimensional data를 2D Projection 하여 표현
- Linear Projections: PCA, Multidimensional Scaling(MDS, data point간 pairwise distance를 보존하도록 Linear Transformation)
- NonLinear Projections: t-SNE, UMAP, isomap, LLE
t-SNE(t-distributed Stochastic Neighbor Embedding)
ML based unlinear projections(tries to match data distribution)
Well-preserves pairwise similarity between points
※ Distortion: MDP에는 왜곡이 존재할 수밖에 없음
- Missing Neighbors: neighbor -> not neighbor
- False Neighbors: not neighbor -> neighbor CheckViz: Missing/False Distortions의 정도를 표현하는 기법
Hierarchy and Trees
Hierarchy
an arrangement of items in which the items are represented as being above, below, as the same level as
simply an ordered set or an acyclic graph
Tree
any connected graph without cycles
Hierarchies can be represented as trees
Visualization of Trees

- Containment(Enclosure diagrams)
- Connection(Node-Link diagrams)
- Depth encoding with position: layering, circular layering, identation
Node-Link diagram
- Node = Element, Links = Branch
- Root at top, Leaves at bottom
problems: 계층이 내려갈 때마다 node 갯수가 크게 늘어남, skewed tree를 그리기 어려움
-> Cone tree(siblings in 2D planes) / Radial Node-Link Tree(siblings around circle)
단점: Inefficient use of screen space, difficult to encode more variables of data cases(shape, color, size)
- Hyperbolic Tree: radial node-link에 hyperbolic geometry를 적용
- Degree of Interests(DOI) Tree: 중요하지 않은 node들은 접어 놓음(생략함)
Treemaps
Space-filling representation
Childen are drawn inside their parent
area encodes quantity attribute
장점: leaf node와 그 attribute에 관심이 있을 때, tree의 topology에 집중할 필요가 없을 때, 변화 모니터링에 좋음
단점: layout을 이해하기 위해서는 훈련이 필요,
Slice-and-Dice Layout
계층이 바뀔 때 마다 vertical - horizontal 번갈아가면서 split
aspect ratio가 나빠 가독성이 떨어짐
Squarified layout
가능한 직사각형을 정사각형에 가깝도록 split
- Minimize perimeter
- Easier to select with a mouse cursor
- Similar aspect ratios are easier to compare(실제 실험해보니 이건 아님)
- Cushion Treemap: shading과 texture를 더해서 전달력 높임
Graphs and Networks
- Graph: abstract representation of a set of objects(vertices/nodes) where some pairs of the objects are connected by links(edges/lines)
- Network: a directed graph with weighted edges
Node-Link Diagram
- Force-Directed Placement: algorithm to find an equilibrium state of the force system defined by vertices and edges
- Multi-level network(Compound network): combination of a network and a tree
- Topological Fisheye View
■ Intuitive, Abstract task, Topology understanding, Unsearchable, No order, Not scalable
문제점: Occlusion(overlapped nodes), crosslink
TreePlus
Represent Graph as Tree(tree + cross links)
Adjacency Matrix
transform into heatmap
Node -> axes, Link -> area mark
■ Unfamiliar to user, Detailed task, Estimating # of nodes, Searchable, Able to reorder, Scalable, Predictability
Hybrid Visualization(Node-link diagram + Adjacency matrix)
readable both for global and detailed structure
-> NodeTrix: globally sparse(node-link diagram) and locally dense (adjacency matrix)
PivotGraph(Attribute-based Layout)
a node with multiple dimensions or attributes
highlight interactions between the various dimensions of a graph

■ Operations
- Roll-up(summarization query)
- Selection
Semantic Substrates
occlusion과 cross link를 해결하기 위한 그래프
- layouts based on user-defined semantic substrates(non-overlapping regions)
- sliders to control link visibility(limit cluster)

Table
tabular data의 arrangement
Categorical
spatial region으로 나타냄(each level is assigned to a distinct contiguous bounded area)
(stacked) bar chart
1 Categorical + 1 Quantitative horizontally separated, vertically alligned / quantitative attribute에 의해 ordering 가능
+ Ordered: streamgraph / dot chart / line chart

※ 순서가 있는 categorical에 line chart를 사용(순서 없으면 bar chart가 좋음)
Heatmap
2 Categorical + 1 Quantitative
+ clustering: cluster heatmap

기타
parallel coordinates, raidal bar chart, star plot, pie chart, polar area chart, normalized stacked bar chart
※ Radial Layout Channel: Angle + 1 or more linear spatial channels
Rules of Thumb
No unjustified 3D
- Power of the Plane / Danger of Depth: 사람은 2.05D 정도의 dimension perception을 하기 때문에, plane이 3D보다 powerful함
- Occlusion이 있어야 depth 인식이 되지만, hide하는 information이 많음
- 원근감으로 인한 왜곡이 존재
- Tilted text는 읽기 어려움
Eyes beat memory
눈을 움직이면서 비교(recognition / external cognition)하는게 기억과 비교(recall / internal memory)하는 것보다 쉽다.
animation보다는 small multiples를 병렬 배치하는 게 더 효과적
Change Blindness: hard to track complex and widespread changes in multi-frame animations
Resolution beats Immersion
Overview first, Zoome and Filter, Details-on-Demand
summary 데이터를 먼저 보여주고, multi-scale structure를 제공
Responsiveness is Required
interaction latency에 대한 visual feedback이 필요(모래시계 커서, 남은 시간 보여주기 등)
Importance of luminance channel
명도 대조(black and white)를 먼저 사용하고, 색상 및 채도는 secondary
Function first, form next
기능적인 부분을 먼저 신경쓰고, 디자인은 나중에