2. Developing application code for (and debugging) an MCU - nathancharlesjones/Embedded-for-Everyone GitHub Wiki
- Software development kits (SDKs)
- Software architectures and design patterns
- General Debugging Tips
- Debugging Tools and Techniques
Disclaimer
Developing and debugging application code is an area of learning for me, and not one that I spent as much time on during this project as the other steps presented on this wiki. What follows is my best attempt at tackling this broad topic, presented mostly as a collection of tips and additional resources.
Software development kits (SDKs)
As explained in the "Getting Started" guides, a "software development kit" is anything that helps you develop software, such as:
- linking in any library code and making sure that your program is placed at the right places in the MCU's memory;
- correctly configuring the MCU after reset to be able to run your code;
- interacting with the various hardware peripherals on the MCU, such as GPIO, timers, UART, etc; or
- providing oft needed functions such as implementing an operating system, bootloading, performing touch sensing, interfacing with any number of external devices, etc.
The first three items above are needed simply to get the MCU up-and-running. The first two items are typically performed by some combination of the compiler and manufacturer-provided startup code; if you're using an IDE, it's usually happening automatically. (For more information about how this happens, I highly recommend "A General Overview of What Happens Before main()" from Phillip Johnston of Embedded Artistry and also "zero to main()" from Francois Baldassari and James Munns of the Interrupt blog.) Together, they are typically called the "start-up code" or "board support package" and are sometimes grouped together with the third item (since all three are very MCU-specific). The third item is known as the "HAL" (hardware abstraction layer) or, sometimes, the "low-level drivers". The last item is a very broad category of software that is typically referred to as "drivers" (if it's providing an interface to an external device) or "middleware" (if it's more like a software utility). Many SDKs include all four.
Specific information about SDKs for the five MCUs that I tested can be found in their "Getting Started" guides.
Finding Start-up Code and a HAL
The easiest (and sometimes only) place to find start-up code and a HAL for your MCU is in the manufacturer's official IDE (or another officially supported IDE). Starting a "project" for your new MCU in this piece of software is almost guaranteed to include the necessary support code for you to simply start writing application code. This often takes three different forms (below).
- Header file: Does nothing except give the MCUs registers (mostly)human-readable names. Using the peripherals requires bit manipulation of the pertinent registers (view the MCU's reference manual for more information).
- Example: "Msp430.h" for the MSP430 (official version available behind an account login at TI Cloud in the Resource Explorer).
- Standalone code: A library that exposes useful functions to the developer. Sometimes these functions are little more than wrappers for register manipulation (e.g. ClearReg()) and sometimes they do so much as to start to resemble the Arduino framework (e.g. UART_Init()). Many of these APIs have strong dependencies on the start-up code that they come bundled with, making it difficult to use them outside the vendor-specific IDE.
- Examples:
- XMC Peripheral Library
- MCUXpresso SDK
- Examples:
- Code generator: An application that generates code based on a list of settings specified by the developer. For example, to use a UART peripheral on an MCU, the developer may simply need to select the appropriate boxes and drop-down menus and then click "generate code" (or some such button) to start using a peripheral. These are typically the easiest to use "out of the box" but often intentionally hide certain implementation details, making it difficult for the developer to write code for the MCU outside of the HAL.
- Examples:
- MPLAB X IDE code generator
- DAVE apps (for the XMC1100)
- STM32CubeMX/CubeIDE code generator (for STM32)
- Examples:
The product pages for many MCUs often includes a list of officially-supported SDKs and IDEs, though you'll often need to sift them yourself for the ones with free licenses. Some will even compile that information into a nice presentation, like this one from ST Microelectronics, or this one, which compares the IDEs, code generators, debug adapters, and other tools that are officially-supported for the STM8 and STM32 MCUs.
Many third-party SDKs also exist (see "A Short List of Useful SDKs" below for a few examples).
Finding Middleware and Drivers
These two categories of SDKs, not usually requiring MCU-specific code, are often much more easily found and "ported" to your specific MCU than start-up code or a HAL. The best place to start looking for these SDKs is, as mentioned above, either alongside the HAL that you are using (since, sometimes, they come bundled together) or on the manufacturer's product page for the MCU you are using. The official HAL for STM32 MCUs, for instance, includes FreeRTOS (a real-time operating system; see below) and FatFS (a file system for FAT formats) libraries, and the documents linked above from ST Microelectronics list many more that are available and officially supported. Third-party middleware will frequently include notes about which MCUs are supported and provide instructions that will show you how to use it with your MCU or, if it's not supported, how to port it to your MCU.
Drivers, as defined above, mostly serve the purpose of helping interface with an external device. Because of this tight coupling, the best place to look for drivers is on the manufacturer's product page for the external device with which you're trying to interface. Sometimes, this code is written with the intent of being used with a different MCU or IDE than the one you're using (as might be the case if the external device with which you're interfacing is made by a manufacturer that also produces MCUs; clearly, they're going to prioritize support code written for their own MCU). How hard it is to port this code to your specific MCU depends on how well the code is written (read: "how loosely-coupled to the underlying hardware the code is" or "how few external dependencies the code has").

A Short List of Useful SDKs
libopencm3
Standalone, open-source start-up code and HAL that was originally intended to support the ARM Cortex-M3 and has since expanded to support many different Cortex-M devices. Documentation for libopencm3 is available online. Follow either link to see if your MCU is supported.
The notes on the github page are sufficient, I think, to get started with libopencm3, but they can be a little impenetrable. My introduction to libopencm3 was by way of "Beginning STM32" by Warren Gay, which made this HAL much easier to use.
ChibiOS
SDK that combines an RTOS (several options, actually) with a HAL (a large number of STM32 devices are currently officially supported; other are apparently supported unofficially via user contributions). Appears as though it can be used with ChibiStudio (in which it would function more like a "code generator") as well as standalone code.
FreeRTOS
Standalone, open-source real-time operating system (RTOS) that includes some additional libraries/utilities (though I haven't tested them myself).
ulibSD
Standalone middleware that implements a SPI-based SD-card interface.
CMSIS Packs
CMSIS, standing for "Cortex Microcontroller Software Interface Standard" is a "vendor-independent hardware abstraction layer for microcontrollers that are based on Arm® Cortex® processors". In 2014, Arm announced a new component to CMSIS called "CMSIS Packs", which would be "a way to package software components, device information, example projects and code templates into an open format". Arm probably maintains the largest library of CMSIS packs (see the full list here; I found the "CMSIS Search" tab to be slightly more useful than the full list), but, being an open format, others are also creating their own. Based on my limited knowledge, it seems as though the Arm CMSIS packs are predominantly HALs, alongside some middleware and a few drivers. If you've used the Keil MDK-Arm IDE at all, you're already familiar with CMSIS packs since that's how Keil manages SDK support. It also appears as though an Eclipse plug-in exists to replicate the Keil "Package Manager", which would allow you to utilize these SDKs in that IDE as well.
Using an SDK
- Learn about what your IDE is doing "under the hood". Recommended resources:
- "A General Overview of What Happens Before main()" from Phillip Johnston of Embedded Artistry
- "zero to main()" from Francois Baldassari and James Munns of the Interrupt blog
- "Embedded System Design on a Shoestring", by Lewin Edwards
- Dissect one of the command-line projects in the "Getting Started" guides and make sure you understand what else gets compiled and linked with your source code to make a working executable.
- Understand that all of your SDKs are simply creating or providing the source code (.c/.cpp), assembly code (.s/.S), header files (.h/.hpp), and linker scripts (.ld) so that the compiler and linker can create a working executable, as mentioned above. If you know how the compiler/linker perform these steps and can locate the files the SDK uses or produces, you're a long way towards being able to incorporate that code into your application.
- Find an interactive and searchable reference that describes the API used by the SDK. The best ones will not only describe the parameters and return values of its functions, but will also describe how to use the SDK to perform commonly-needed tasks and provide some example code.
- Not all SDKs are written the same: understand that some are written with very few external dependencies, and these are the easiest to incorporate into your projects. The ulibSD library, mentioned above, is one such example: someone who wants to use that needs only to define a little less than a dozen MCU-specific functions (e.g. SPI_RW, SPI_Timer_On, etc) for the library to work. A not-so-terrible example a little further down the spectrum might be one of the SDKs provided for the three Arm MCUs I tested (XMC1100, LC845, and STM32G0). Those SDKs rely heavily on their own startup code and a group of CMSIS header files, which help to make the SDK broadly applicable to a number of MCUs from the same manufacturer. However, it also makes it rather difficult to substitute your own startup code or to intermix two different HALs. If you can understand which things (files and external parameters) your SDK is dependent upon, you're another huge step to being able to incorporate that SDK into your project.
- For header files and standalone code:
- Either compile the source code alongside your application code or link in the static library. Don't forget to include any header files.
- If you're working in an IDE, this may simply mean adding the appropriate files to your project.
- If you're working from the command line, this means adding the header file locations to your include path and either compiling the standalone source code and linking the resultant object files with your other object files or just linking in the static library file when everything gets linked into the final executable.
- You may need to include other header files or preprocessor definitions if the one you want to include has external dependencies.
- Either compile the source code alongside your application code or link in the static library. Don't forget to include any header files.
- For code generators:
- Build your code with the code generator.
- If you can get access to the source code that was generated (as in the case of something like STM32CubeMX), you can simply follow the same steps as above to add it to your application code.
- If you can't, you may need to develop the rest of your application from within the IDE that's linked to the code generator.
Software architectures and design patterns
This is an unbelievably broad topic and not one that I'll attempt to tackle here. Instead, I'll refer the reader to the following (which have proven helpful to me):
- "Making Embedded Systems", by Elecia White
- "Design Patterns for Embedded Systems in C", by Bruce Powell Douglass
- "Better Embedded System Software", by Phillip Koopman
- "Test-Driven Development for Embedded C", by James Grenning and the author's website

General debugging tips
From "Debugging", by David Agans (seriously, read this book):
- Understand the system
- Make it fail
- Quit thinking and look
- Divide and conquer
- Change one thing at a time
- Keep an audit trail
- Check the plug
- Get a fresh view
- If you didn't fix it, it ain't fixed
I've also found this article by Phillip Johnston of Embedded Artistry (among others about debugging [scroll down to the section titled "Browse by tag" to see the list of blog articles that were tagged with "debugging"]) to be highly insightful!
Debugging tools and techniques
Multimeter
One of the two tools that are assumed to be in the reader's possession, at this point (along with a debug adapter). (If you don't, cheap multimeters can be found easily on Amazon, Digikey, or Adafruit.)
Even if your multimeter has more mileage than your minivan, perusing both Sparkfun's guide on "How to Use a Multimeter" and Control Automation's "Digital Multimeter (DMM) Tips and Tricks" could teach or remind you how to best use this steadfast tool. For instance, the second article will show you how to use your DMM in a pinch as a wire jumper.

Debug Adapter
If you've made it this far in the wiki, you likely already own one of the debug adapters mentioned in "Pick a new MCU". (If you don't, many notes have been provided about how to acquire a debug adapter, both in the section linked above and in each of the Getting Started guides.)
Basic Operation
The best place to learn how to use your debug adapter to step through code, set breakpoints and watchpoints, and read and write to memory and registers (the most common uses of a debug adapter), is to find a tutorial or "how-to" guide for the specific IDE that you're using. These manuals or tutorials may also show you some more of the advanced features of whatever software debugger you're using. For instance, GDB (which many software debuggers emulate or even use directly) supports:
- setting breakpoints to trigger only when an expression evaluates as TRUE,
- setting temporary breakpoints (which delete themselves after the first time they're triggered),
- running scripts or other commands when a breakpoint is hit,
- catching C++ exceptions,
- ignoring a breakpoint a specific number of times,
- showing the program call stack (which function is currently executing, which function called that one (and on back to the reset handler), and information about the arguments and local variables associated with each frame),
- setting breakpoints using regular expressions,
- and others.
The possibilities are, quite nearly, endless. Here are a few neat examples of using GDB that may also be available in the debugger you are using:
- Halt the program when a specific message is sent:
b BREAKPOINT if MESSAGE="Some message." - Halt the program on the 10th iteration of a loop:
b BREAKPOINT if idx=10 - Print local variables every time a breakpoint is hit:
(gdb) b BREAKPOINT //Assume that GDB tells us this breakpoint is number 1
(gdb) command 1
Type commands for breakpoint(s) 1, one per line.
End with a line saying just "end".
>info locals
>end  //Ends the sequence of commands to be run after breakpoint 1 is hit
- Skip over a misbehaving section of code:
(gdb) b BREAKPOINT //Placed right before the section of code to be skipped; Assume this is breakpoint number 1
(gdb) command 1
Type commands for breakpoint(s) 1, one per line.
End with a line saying just "end".
>silent //Suppresses normal GDB output
>jump LINE //New place to begin execution after the section of code to skip
>continue //Automatically continues execution after the jump is executed
>end
These, and other tips and tricks, are available from the following resources.
- GDB Quick Reference Card
- "8 GDB Tricks You Should Know"
- "5 Easy Ways to Reduce Your Debugging Hours"
- "Debugging with GDB"
- "Core Dump"
Serial Interface
The second use you are likely to have for your debug adapter is as a serial output device, like using the "Serial Monitor" with "Serial.print" in the Arduino IDE. The low-cost debug adapters presented previously accomplish this in a handful of ways.
- Some debug adapters, such as the Launchpad development boards from TI, will register with the host computer as two USB devices: one for the debug connection and one for the serial connection. The debug adapter, in turn, is connected to both the programming pins on the target MCU AND one of it's UART peripherals. The manufacturer's IDE will likely connect to this port automatically, but any other terminal program (PuTTY, TeraTerm, the Linux "screen" command, etc) will also connect to this port.
- The Segger J-Link features something called "Real-Time Transfer", which serves as a multi-channel, bi-directional serial interface. Segger also claims that it runs much faster than competing solutions. It only needs to be connected to the programming pins, as opposed to the first option.
- Arm MCUs will support something called "semihosting" which, similar to RTT, uses the programming pins to transmit serial data between the target and host.
The quickest way to get started with serial communication like this is either to find an example program for your MCU that exercises this feature or search the product page/Google for information about "semihosting" or "console output" for your specific MCU. If, for whatever reason, you can't get serial output using the debug adapter you have then you could also always purchase a separate USB-to-UART adapter (see below) and use one of the MCU's UART peripherals.
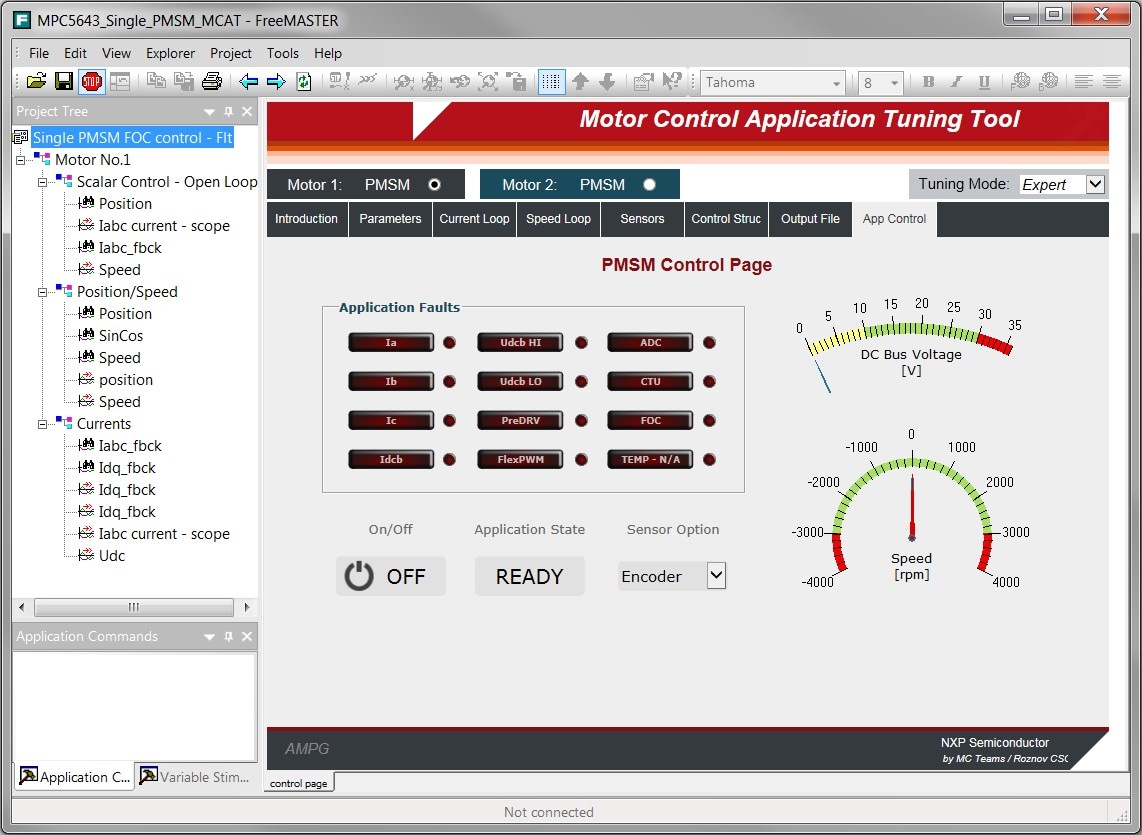
Graphical Interface
The third and final use you might have for your debug adapter is in combination with a program running on the host computer that gives you a slightly different view into your system. These programs are like a graphical heads-up display: they read your source code and allow you to map variables onto output devices (like charts, gauges, cylinders, and LEDs) and input devices (like buttons, check boxes, sliders, and number fields) that update in real-time as your code is executing. This gives you great visibility of crucial variables and an easy way to interact with your program. **NOTE: As mentioned below, the only freely available software that I could find to do this, FreeMASTER from Freescale, only works with NXP/Freescale MCUs. I think this is a powerful tool, though, and I'm on the hunt for more.
- Freescale FreeMASTER (only available for NXP/Freescale MCUs)
Multi-function Instrument
The next tool you'll likely need is an oscilloscope or logic analyzer, as they allow you to see what's actually going on with your signal lines. There are a number of excellent entry-level options (particularly if you don't mind the device being slightly used), but it's my opinion that they can't hold a candle to multi-function instruments which combine an oscilloscope, logic analyzer, variable power supply, arbitrary waveform generator, and other tools into a single device. They often more than make up for a lack of performance with an abundance of features, which is probably more important than performance to the hobbyist anyway. Two such options are below.
- Espotek Labrador, $29
- Oscilloscope (2 channel, 750ksps)
- Arbitrary Waveform Generator (2 channel, 1MSPS per channel)
- Power Supply (4.5 to 12V, 0.75W max output, with closed-loop feedback)
- Logic Analyzer (2 channel, 3MSPS per channel, with serial decoding)
- Multimeter (V/I/R/C)
- Digilent OpenScope, $149 ($120 for students/teachers/researchers)
- 2 oscilloscope channels with 12 bits at 2MHz bandwidth and 6.25 MS/s max sampling rate
- 1 function generator output with 1MHz bandwidth at 10 MS/s update rate
- 10 user programmable pins configurable as either user-programmable GPIO or as a 10- channel logic analyzer.
- User programmable power supplies supplying up to 50mA and ± 4V power
- USB bus powered or externally powered
- On-board WiFi
- Browser-based WaveForms Live multi-instrument software
- Re-programmable through Arduino IDE or Microchip MPLAB X IDE
- Digilent Analog Discovery 2, $279 ($179 for students/teachers/researchers)
- Two-channel USB digital oscilloscope (1MΩ, ±25V, differential, 14-bit, 100MS/s, 30MHz+*)
- Two-channel arbitrary waveform generator (±5V, 14-bit, 100MS/s, 12MHz+ bandwidth*)
- 16-channel digital logic analyzer (3.3V CMOS and 1.8V or 5V tolerant, 100MS/s)
- 16-channel pattern generator (3.3V CMOS, 100MS/s)
- 16-channel virtual digital I/O including buttons, switches, displays, and LEDs, which is perfect for logic training applications
- Two input/output digital trigger signals for linking multiple instruments or providing an external trigger source
- Network Analyzer with Bode, Nyquist, Nichols transfer diagrams of a circuit. The Network Analyzer has a range of 1Hz to 10MHz
- Spectrum Analyzer capable of power spectrum and spectral measurements (noise floor, SFDR, SNR, THD, etc.)
- Data Logger with exportable data and plot functionality
- Protocol Analyzer with SPI, I2C, CAN, AVR, and UART
- Two programmable power supplies (0…+5V , 0…-5V). The maximum available output current and power depend on the Analog Discovery 2 powering choice.
USB-to-UART bridge or Multi-protocol Adapter
A standard USB-to-UART bridge is useful for serial communication between the host and target, of course, though it's not likely needed for that purpose if the debug adapter being used provides that already. However, multi-protocol adapters, which can do that and more, can be invaluable. These devices can connect to and read additional communication protocols (such as SPI, I2C, CAN, and others) and make the data available to your host computer. These can be used for debugging purposes (e.g. observing what data is actually being sent back and forth, halting program execution when specific messages are sent or received, etc) as well as for testing purposes (e.g. sending dummy or spoofed SPI/I2C/CAN data to the target MCU to mimic another connected device that isn't available). Some also give you control over some GPIO or offer a number of other interface options.
- FTDI: Channels configurable as JTAG, UART, SPI, I2C, and others
- TIAO USB Multi-protocol Adapter (based on the FT2232H; $39 from the Amazon Marketplace or $29 from DIY Gadget)
- Espotek Labrador, $29
- Digilent Analog Discovery 2, $279 ($179 for students/teachers/researchers)
A USB-to-UART adapter can also be used instead of a debug adapter with the graphical debugging tools mentioned above.