5.0 Using Flamingo - mkarir/flamingo GitHub Wiki
Using Flamingo
(Using the Flamingo Client)
The Flamingo client runs under X-Windows. From a shell prompt on an X-Windows desktop just type;
flamingo &
This should launch the client, opening the 3 windows pictured below. (On some systems, you may need to specify the full path to the flamingo executable.)
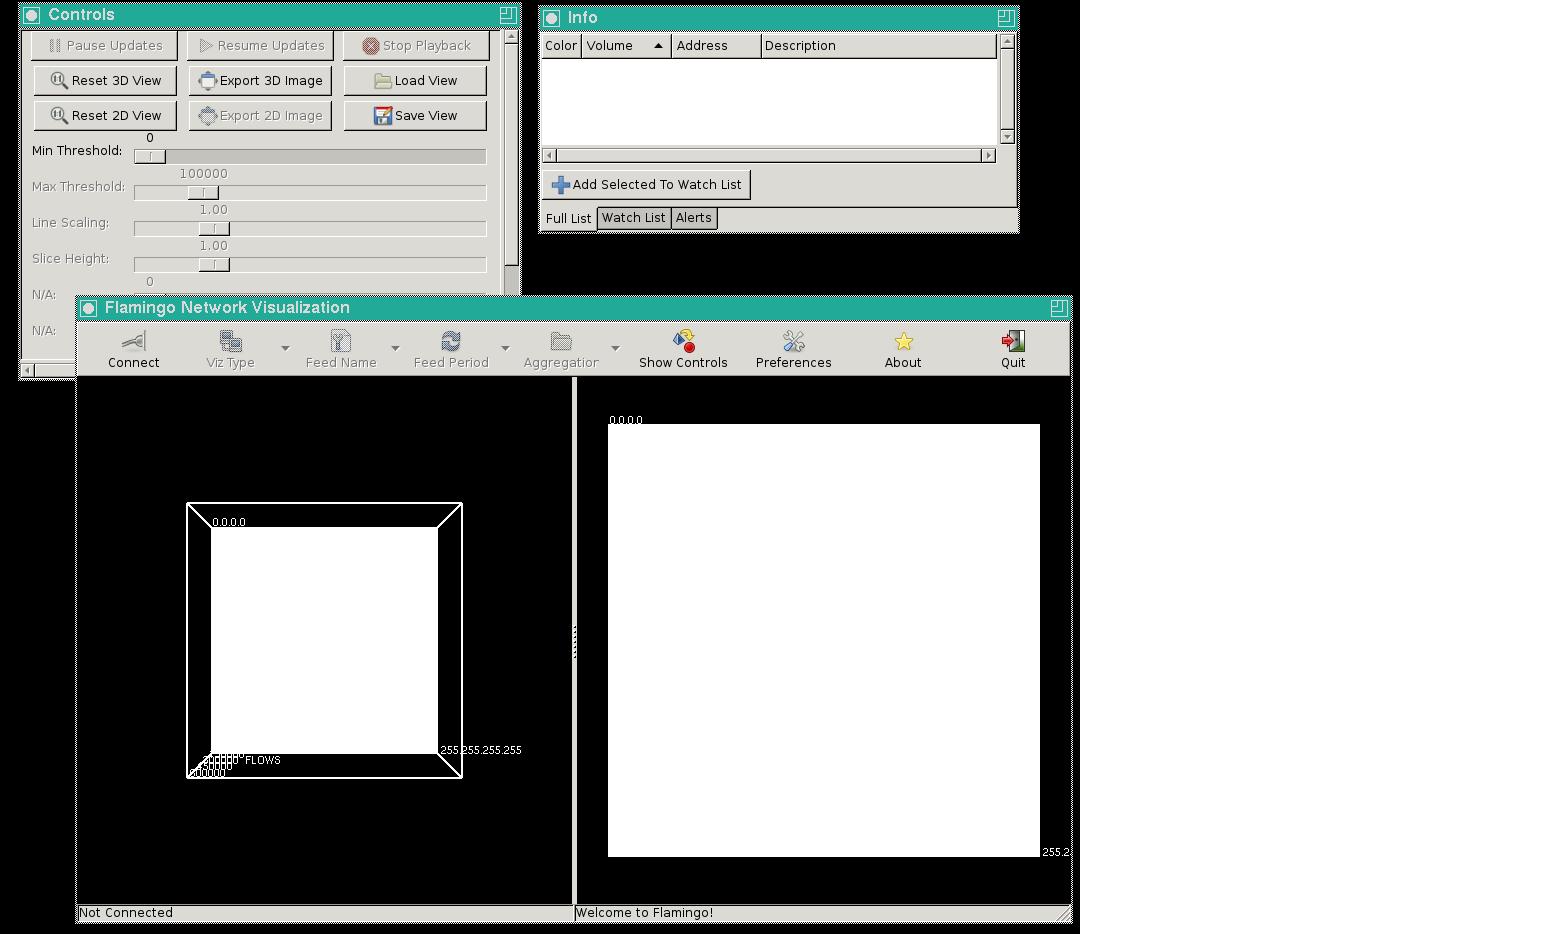
The three windows are called Controls, Info, and Flamingo (or the “Main Flamingo Window”.) In the picture above, note the white text surrounding the white cube and square. If this is not present then it is most likely that Flamingo has been compiled with libraries which are too new, and will not be able render any text labels in the visualization area. This condition would seriously limit the value of Flamingo and should be corrected. See Compiling Flamingo.
Flamingo needs to be connected to a server called pond. Find and click the “Connect” button. This should open the “Connect” window which will ask for a server IP address, a server port and a password. In the case of a default pond.conf and with the client running on the same machine as the server, you can use 127.0.0.1 for the address, 4444 for the port, and flamingo for the password. Click the “Connect” button on the “Connect” window. The Connect button on the main “Flamingo” window should now have changed to a Disconnect button.
The default view (just to the right of the “Connect/Disconnect” button) should be Src IP (Source IP Address). This view can be changed with the drop down arrow next to the view icon. (But lets leave it as “Src IP” for now.)
Some of the default settings may not be the best for all router flow data. For the traffic of many routers you could try changing 10 Seconds to 1 Second with the pull down arrow next to the update period icon (which looks like a refresh button). On the “Controls” window, slide the elevator down and check the “Enable Labels” check box
On the Main “Flamingo” window, you should have a 3d view on the left and a 2d view on the right. The bar separating them can be slid right and left by grabbing the center of the bar with your mouse and dragging it. Some users prefer to slide it all of the way to the right to eliminate the 2D view and make more desktop space for the 3D view.
Mouse Navigation in the 3D Viewing Area
Mouse over the 3D cube viewing area and then;
Left click and drag right, left, up, or down to rotate the cube. Right click and drag to reposition the cube right, left, up, or down. Hold down the mouse roller (or center button) and drag (not roll) up and down to zoom in and out.
About the tool bar
The Tool Bar is located on the Main Flamingo window. By default it is at the top of the window. The first icon on the tool bar is the Connect/Disconnect button. This button is used to connect and disconnect the flamingo client to/from a flamingo server (pond).
The next 4 “Buttons” are not quite buttons, just icons displaying a state with a pick list next to each to change the state.
The second icon is the View Type icon. Below this icon is displayed the current view type. The default view is Src IP (See below for description). Just to the right of this icon is an arrow. Clicking on this arrow will display a pick list of views from which you may select other views.
The third icon is the feed name button which displays the current feed name. These would generally correspond to the various routers in the network which are sending NetFlow or sFlow data. This also has a similar arrow for a pick list.
The fourth icon is update period icon. This icon also has a pick list to select from. This is the number of seconds flamingo will accumulate data before updating the visualization. Changing this time changes both the time a display will remain on the screen, and also the amount of data which will be displayed at the next update.
The fifth icon, which looks something like a “folder” is the Aggregation button. This too is changed with a pick list between Aggregated and Not Aggregated. Aggregated (the default) uses the routing table snapshot in /usr/local/share/flamingo/data/ to collect all of the flows for a particular network and display them visually as one larger block. Not Aggregated attempts to display each individual IP address separately. Each option has its place, depending on other filter settings. Aggregated tends to work better when attempting to display very large IP address ranges, in the first 6 view types (Src IP, Dst IP, Src AS, Dst AS, Src Port, Dst Port) but aggregated tends to get in the way as the address ranges selected for the floor of the cube get smaller. The last three view types (All of which begin with Src/Dst) seem to work equally well or better "not aggregated" even with the address range all of the way open.
The sixth icon is the Show Controls button. All it does is bring the Controls window to the front of other windows, followed by the Info window.
The seventh icon is the Preferences button, this opens the Preferences window. This window has three very distinct tabs, General, Ranges, and Alerts. The Ranges tab tends to get the most use. We will discus this window and its tabs in more detail below. It should be mentioned here that his window should not be left open! When this window is open the other functions of the tool bar are not accessible. The Playback window has the same effect. If you should fine yourself with a tool bar which is not working, you most likely have a Preferences window or a Playback window open, under your other windows. Close it to restore the functions of your toolbar.
About and Quit should be self explanatory.
About the Views
Flamingo supports the following views.
Src IP (Source IP Address)
Dst IP (Destination IP Address)
Src AS (Source Autonomous System Number)
Dst AS (Destination Autonomous System Number)
Src Port (Source TCP or UDP Port Number)
Dst Port (Destination TCP or UDP Port Number)
Src/Dst IP (Source and Destination TCP or TDP Port Numbers)
Src/Dst AS (Source and Destination Autonomous System Numbers)
Src/Dst Port (Source and Destination IP Addresses and TCP/UDP Port Numbers
Each view can be modified extensively by adjusting constraints which we will discuss later.
About the floor of the cube in the first 6 views
With Src IP, Dst IP, Src Port, and Dst Port, the floor of the cube is the entire IPv4 address space or a subset thereof. (This is adjusted with the Preferences window Ranges Tab, see below.) These views generally require aggregated data in order to render correctly unless the IP address ranges displayed are substantially reduced.
With Src AS, and Dst AS views the floor of the cube is the range of 16 bit AS numbers. (32 bit AS numbers are truncated to 16 bits, as of this writing) Traffic displayed is aggregated by AS number.
About the Z axis of the first 6 views
With Src IP, Dst IP, Src AS, and Dst AS views, the Z axis is traffic volume. The Z axis scale may be adjusted on the Preferences window, General tab, “Max Threshold Maximum” and/or on the Controls window by unchecking “Disable Max Threshold” and using the “Max Threshold” and “Min Threshold” sliders. This second method does not attempt to display data which would extend beyond the limits of the cube, and thus may not always be desirable.
With Src Port and Dst Port the Z axis is the Source or Destination TCP/UDP port. The limits of Z can be adjusted on the Controls window using the “Min Port” and “Max Port” sliders. In these views the “Slice Height” slider is very helpful, the “Min Threshold” slider is active, and the “Max Threshold” slider can be enabled by unchecking the “Disable Max Threshold” check box.
About the last three views (Src/Dst views)
All of these views need to use the Z axis for something other than traffic volume, as such the volume of data is represented by the thickness of a line between two points. This thickness can be adjusted using the “Line Scaling” slider on the Controls window.
The view “Src/Dst IP” uses the left wall of the cube as the source IP , the right wall of the cube as the destination IP, and the thickness of the line between them to represent the volume of traffic. The left and right walls of the cube can be the entire IPv4 address space or some subset thereof. Each wall (source or destination) can be adjusted independently using the Preferences window, Ranges tab, Source Range, and Destination range, respectively.
Src/Dst AS is very much like Src/Dst IP described above except that the right and left walls are the range of 16 bit AS numbers. If a particular feed (router) is not running BGP, the NetFlow/sFlow data will not include AS numbers (all data will be AS 0).
Src/Dst Port is rather unique and particularly useful. This view uses the floor of the cube as the whole IPv4 address space, or a subset thereof. The Z axis is the range of TCP/UDP ports, or a subset thereof. A line is drawn between the source IP/Port and the destination IP/Port. The volume of traffic is displayed by the thickness of the line. This view is particularly useful for spotting port scans, DDOS attacks and other traffic anomalies. It should also be noted that this, most useful view, is available regardless of whether the flow generator (router) is running BGP.
Next, we give a brief description of each view and what it can be used to visualize.
Src IP (Source IP Address)
This view shows traffic (In the Z axis) of each IP address in range (perhaps the whole IPv4 space). This view helps identify “Top Talkers”. It can be particularly useful when running Not Aggregated, and zoomed in on a particular “Class C” sized block of IP addresses. (See Preferences Window, Ranges Tab below)
Dst IP (Destination IP Address)
This view is much like Src IP above but is useful to find “Top Listeners”, which would likely be “bandwidth hoggs”, since most office or campus locations consume more inbound traffic then outbound traffic.
Src AS (Source Autonomous System Number)
This view is useful for Identifying what types of data your users are consuming. For example, a typical higher education campus may see high Youtube (Google) traffic and also high Netflix traffic. This information can be very helpful if your network is large enough to establish direct peering relationships with select content providers.
Dst AS (Destination Autonomous System Number)
This view is very similar to Src AS but in the reverse direction.
Src Port (Source TCP or UDP Port Number)
This view can be helpful when zoomed into a single campus or building IP address range for differentiating between clients and server (which generally use lower well known ports). The can be helpful for identifying departmental servers which may be candidates for relocation into data centers.
Dst Port (Destination TCP or UDP Port Number)
The view is very similar to Src Port above.
Src/Dst IP (Source and Destination TCP or TDP Port Numbers)
This View is helpful for visualize who is talking with whom, and with what volume. It could be networks or individual IP addresses.
Src/Dst AS (Source and Destination Autonomous System Numbers)
This view is helpful in the same way as Src AS and Dst AS. In this view Volume is more relative and less quantitative, but both Source and Destination are available in one view. It should be noted that AS information is only available from routers running BGP. It should also be noted that destination addresses learned by other routing protocols such as OSPF will show as AS 0 (Unknown).
Src/Dst Port (Source and Destination IP Addresses and TCP/UDP Port Numbers)
This is perhaps the single most interesting and useful view for assessing network health and anomalies. If we had to choose only one view to remain active 24/7 on a Network Operations Center (NOC) Wall of Monitors, it would be this view.
With this view, it does not take an engineer to spot an anomaly or even recognize normal traffic patterns, and thus the lack of anomalous traffic. Entry level technicians and even corporate executives can, with just a little experience, spot something “out of place” in this view. It may take an engineer to diagnose just what it is, and what to do about it (if anything) but more eyes are always helpful.
Lots and lots of “knobs to turn” (or slide)
Coming soon