Interpreting data using HapFlow - mjsull/HapFlow GitHub Wiki
The basics
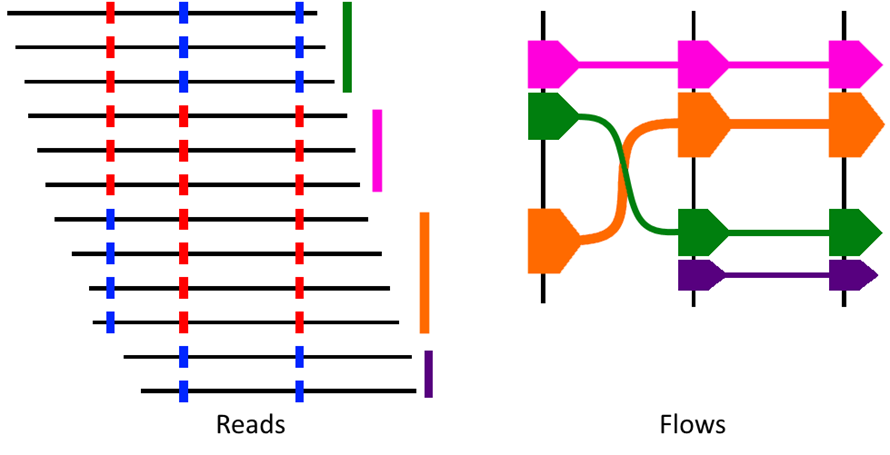
The left images shows sequenced reads aligned to a reference genome - the vertical lines to the right of the reads indicate which flow each read was assigned to. The corresponding "flows" are shown in the right image.
Two alleles are present at each of 3 variant sites. The most common allele at each site is indicated with a red bar and the least common is indicated with a blue bar. HapFlow determines the variant profiles of all reads. It then creates a flow for each unique variant profile. Each flow represents a read or reads with that variant profile. Width of the flow indicates the proportion of reads with the profile. Black vertical lines indicate variants and position of the flow in the Y axis indicates which variant is present at that position in the flow. Direction of the arrow indicates the direction of the reads from which the flow was created.

Paired-end reads
Aligned reads
Similar to the first example, two alleles are present at each of 3 variant sites. The most common allele at each site is indicated with a red bar and the least common is indicated with a blue bar. This example differs as it has an (unlikely) arrangement of paired-end reads. Direction is indicated with an arrow on the end of the read, pairs are joined by a dotted black line.
Flows - HapFlow representation of sequence data
A blue bar at the top of the screen represents the genome, an orange rectangle within the blue bar represents the portion of the genome currently being displayed. Underneath, an orange bar with vertical lines represents where the variants are located within the displayed section of the genome. These lines are extended below and spaced an equal distance apart in the area where the flows are viewed. At each variant, each flow covering the given variant is represented by an arrow, with the width of the arrow representing the number of reads the flow contains. The arrows representing each flow at adjacent variants are joined by lines, with solid lines representing variants covered by the same read of the flow (e.g. the light green and dark Green flows) and dashed lines representing variants covered by different reads in the pair (e.g. the orange flow). If a variant falls between the pairs of the reads that make up the flow, the two ends of the flow are connected by a straight, black, dotted line (e.g. the pink flow). These lines can be toggled on and off using the "Hide gapped" and "Show gapped" commands in the View menu. Arrows grouped at the top of the canvas represent the most frequently observed allele, the second group of flows represents the second most common allele and so on. Flows that start on the vertical line (not before or after) indicate a flow where the variant falls on the first base of the reads in the in the flow (e.g. the dark green flow). This is done because ends of reads are often misaligned. This occurs most commonly when the variant is a variable copy number tandem repeat. Likewise, flows that end on the line indicate reads where the variant falls on the last base of a read (Light green). HapFlow attempts to group flows according to consensus, If a flow is in consensus with shared alleles in a previously defined group, it is assigned that group - group number is then used to determine the hue of a flow. For example, the light green flow is in consensus with the dark green flow (and therefore is assigned the same hue).
Information about the sequence of each variant is represented underneath the flows. The allele in the reference is indicated with an asterix (*) (Pictured below). Finally, arrows on the bottom row represent alleles not identified in the VCF file (Pictured below). This can be caused by potential sequencing, alignment or variant calling errors.
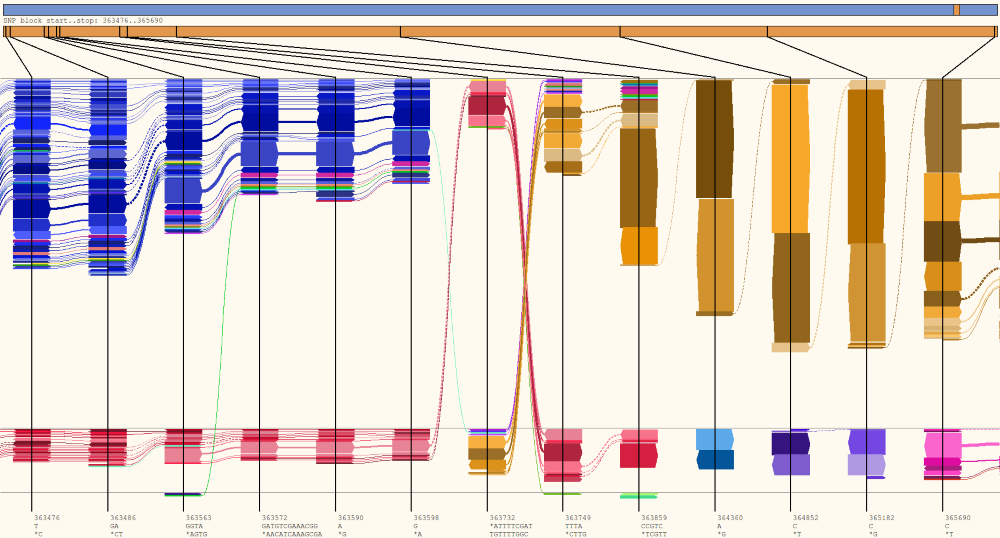
HapFlow representation of paired-end Illumina reads from a mixed strain Chlamydia infection. Flows containing only the dominant allele group at the top, flows containing only the minor allele group at the in the second row, mixed flows switch between top and middle. The bottom row indicates flows containing an alignment or sequencing error. All reads with the most common allele at base 363,598 have the least common allele at base 363,732, similarly all reads with the least common allele at site base 363,732 have the most common allele at base 363,749.