plot_samtools_depth.R - mjmansfi/genomics_scripts GitHub Wiki
plot_samtools_depth.R
A script to plot different parameters based on the output of samtools depth -a [sorted, indexed bamfile]. The -a flag is very important because all positions for all sequences need to be represented in the data. The script contains a rudimentary check to make sure that this is true for your input data - so the script should complain if you do not use this flag - but in case it doesn't, just make sure to use that flag.
Non-base library dependencies:
optparse- to gather and parse input argumentsdata.table- to efficiently read in data tablesR.utils- to read compressed data tablesviridis- to allow more colourful (and colourblind-friendly) plots
Required arguments:
-d, --depthFile
Path to a file containing the output of samtools depth -a. Can be gzip compressed. The input should look like:
seq1	1	5
seq1	2	6
seq1	3	0
...
seqN	X	Y
where the columns correspond to sequence name, position, and depth, respectively. Note that the original sequence names from a FASTA file may be truncated while creating the depth file. To avoid this, ensure that the sequence names in the FASTA file are simple before doing read alignment (e.g., by using python/fasta_rename_with_table.py).
Optional arguments:
-o, --outFile
Base output name. If not specified, the default is [depth file input name]. The script automatically appends the strings _depthPlot.pdf, _depthPerSeqBarplot.pdf, and so on to the base output name. If these files exist already, the script will complain; use --force to override this.
-w, --windowSize
Window size over which average depth values are calculated. By default, the script does not calculate any windows (because by default --windowSize is 1). This may result in a noisy coverage plot (and sometimes large-scale coverage trends are more interesting than local coverage spikes), so taking the average over segments of size --windowSize alleviates this. If the end of a window extends beyond the end of a sequence, the end is used as the boundary instead.
-s, --stepSize
Size of steps between window intervals, necessary for calculating sliding window averages. By default, --windowSize is 1 and no windowed averages are calculated. If --windowSize is specified but --stepSize is not, by default, --stepSize equals --windowSize (no sliding windows). Sliding windows are only calculated when --windowSize is greater than 1 and --stepSize is a manually specified number smaller than --windowSize. If --stepSize exceeded --windowSize, there would be chunks of data missing!
-f, --filter
Comma-separated list of query sequences to analyze. Useful if you are interested in one or a few sequences represented in the depth file. Note that this filter statement is sensitive to strange characters and whitespace, so if you want to use this feature make sure that the sequence names in the depth file are simple and easy to specify. For example: --filter seq1,seq5
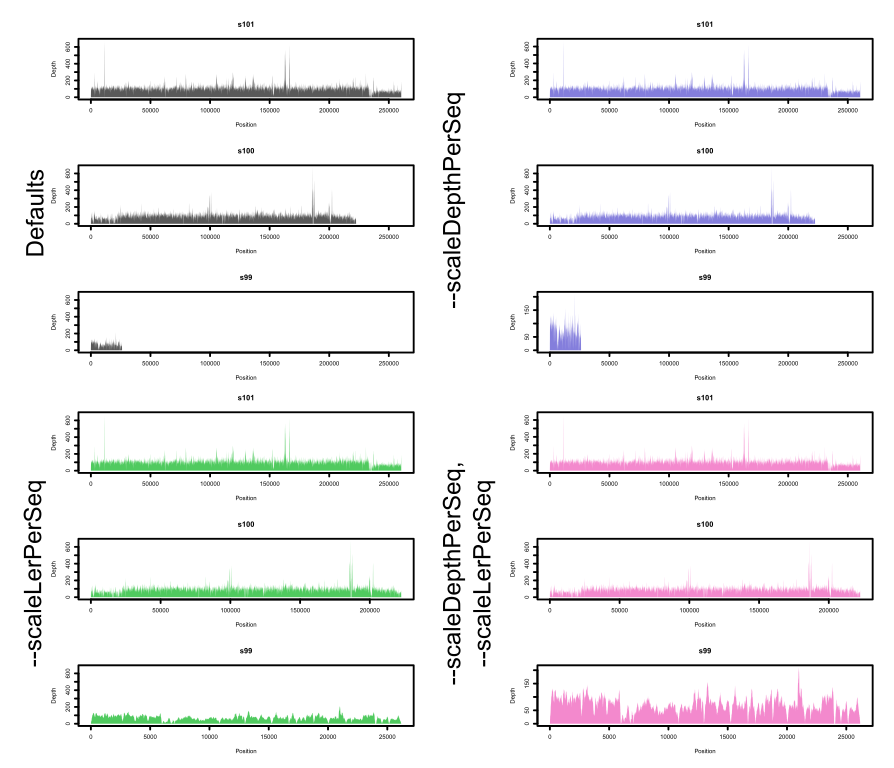
--scaleLenPerSeq, --scaleDepthPerSeq
Scaling options that determine the limits of each plot on the X (length) and Y (Depth) axes. The following image (which, for now, is manually coloured) shows what these options do more clearly:
--seqsPerPage
Option to include multiple sequences on a single PDF page. By default, one sequence is shown per page in the depth plot. Increasing this is mostly useful if long, thin plots is preferable to the square ones produced by default. However, this number cannot be more than 5, because base R will start to complain about margin sizes. I recommend post-processing in Inkscape or similar.
Do note that this affects the way barplots are distributed if --plotDepthPerSeq is specified.
--plotDepthPerSeq
Optional barplot output displaying average coverage per sequence in the depth file, coloured by sequence length. Example:
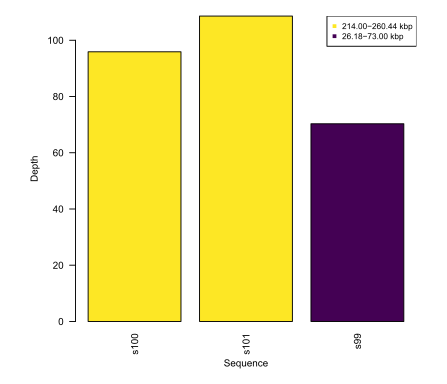
Colours can be changed with the --viridisPalette argument.
--useSplines
Fit smoothing splines to coverage distributions instead of raw counts (or window counts). Example:
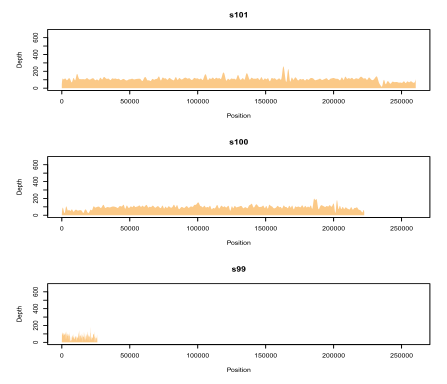
The splines sometimes make it easier to spot trends in the data, and also drastically reduces the number of vertices in the polygon, making it easier to manipulate in external image editing programs. But, sometimes it looks a bit silly, especially for low-coverage sequences.
-t, --threads
Number of threads to use for parallel processing.
--writeDepthPerSeqTable, --writeDepthWindowTable
Optionally write tables of per-sequence coverage or per-window coverage to external tsv files.
Example --writeDepthPerSeqTable output:
Sequence	Length	Depth_mean	Depth_median	Depth_sd
seq1	12500	200	180	20
seq2	4200	210	100	80
seq3	2000	80	88	10
...
seqN	W	X	Y	Z
Example --writeDepthWindowTable output:
Sequence	Start	End	Depth_mean	Depth_median	Depth_sd
seq1	1	1000	210	200	19
seq1	1001	2001	180	192	12
seq1	2001	3001	88	10
...
seqN	V	W	X	Y	Z
--verbose
Print nice summary messages.
--force
Force overwrite of existing output files.