Profiling slow CMS operations - mitikov/KeepSitecoreSimple GitHub Wiki
Complaining
I have heard a lot of people complaining about slow applications.
Is there a way to find what causes slowness, or our destiny is to to listen to complains all life ?
How can we track the culprit of the sluggish functioning ?

Promise to try
We can give a shot using dotTrace .NET Performance Profiler.
It can record both local, and remote application ( via service ) code flow, memory allocations, exceptions raised, SQL Queries being executed and so on...
3 minutes intro worth to be seen to get a high level overview.
In short - the application can record tons of information, thus it`s extremely easy to get lost in the provided data.

One step at a time
In order not to sink in large volume of information, a simple set of steps must be followed:
- Profile session must be as short as possible to avoid capturing other application noise.
Chances are high that among dozens of threads running simultaneously, you are only interested in one thread output.
Please also take into account that thread would be most likely returned to Threadpool, and get a new task for processing. Thus stopping profile just after slow operation is over is mission-critical.
- Profile session must have only one logical operation.
They would tell you that everything is slow. But you must be strong not to panic earlier than needed. Your goal is to break "everything" word into a set of scenarios (f.e. exact page URL opening, or saving data is slow).
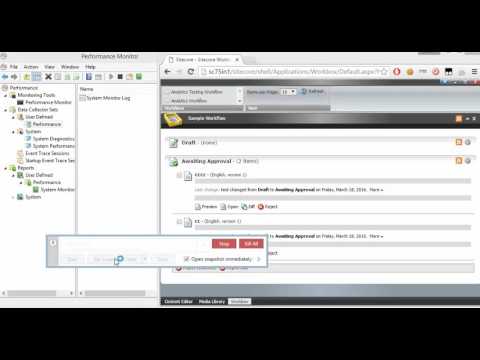
A good scenario is "My life is too short to wait for a Workbox to open", and we`ll have a related demo later.
- Same scenario should be profiled a few times
Each modern application has caching layers, security providers, database layer. Thus overall performance varies on different factors. We should take a few profiles to get averaged values.
Demo: My life is too short to wait for a Workbox to open
Action plan
Configure dotTrace profiler should be configured as per image (Tracing session and all the other stuff):

NOTES
-
Start immediatelyMUST be UNCHECKED. Otherwise you`ll get tons of useless data that overlaps needed. -
Tracingmode should be picked for correct metrics, rather than random samples.
Steps to take
-
Prepare slow operation ( Opening Workbox in our demo )
-
Start profiling session
-
Launch slow operation
-
Wait till operation is completed
-
Stop capturing profile
-
Reproduce aforementioned steps 2-3 times
Video for more details
Should any question arise, please watch the demo:
Analyzing Results
The amount of time spend for slow operation is usually an aggregation of many fast operations, as in our case:

A "Workbox" text filter was applied (CTRL+F) to find a needed thread among all.
What can be done
- An amount of operations should be reduced, so in our case we can limit number of rows read from database to show in Workbox.
- Security-related cache should be increased, cache key-indexing can be enabled.
- Ensure to have low fragmentation levels for SQL Indexes
Conclusion
DotTrace is a powerful application, but only when used wisely. It will help you to get insights on application internals and will allow you to test performance of different code variations.
It introduces an application overheat, thus be ready to get higher timings during profiling than in real life.